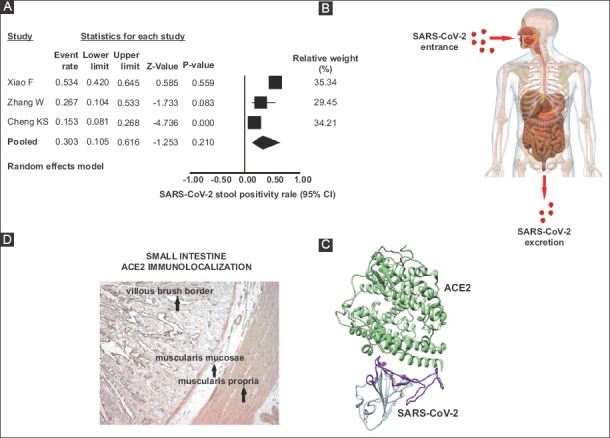
Figure 6.

(A) Forest plot showing individual and pooled prevalence ratios (95% confidence interval) of SARS-CoV-2 RNA detection in feces (B) Cartoon representation of the SARS-CoV-2 fecal route transmission. (C) Ribbon diagram depicting the SARS-CoV-2 attachment to ACE2 receptors (modified from ref. 66) (D) ACE2 small intestine immunolocalization (modified from ref. 12)
ACE2, angiotensin-converting enzyme 2
