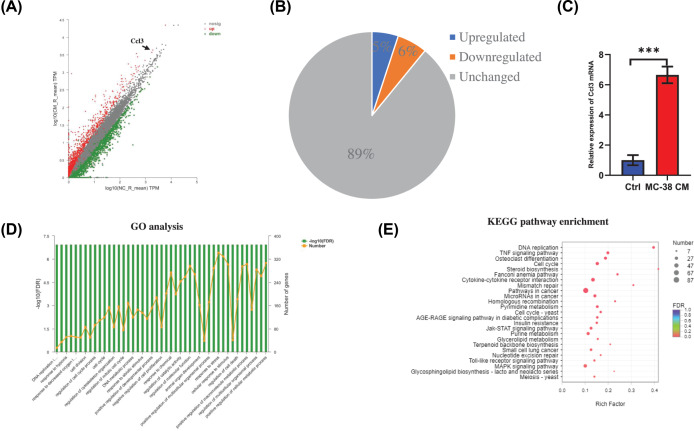
Figure 2. CCL3 is up-regulated during osteoclastogenesis of BMMs treated with secreta from CRC cells.
(A) Scatter plots showing the differentially expressed genes in BMMs during osteoclastogenesis between MC-38 CM treated group and control group. (B) Pie chart revealed the percentage of up-regulated, down-regulated, and unchanged genes in MC-38 CM treated group comparing with control group. (C) RT-PCR analysis showing the mRNA expression of CCL3 in MC-38 CM treated group and control group. (D) GO functional clustering of genes that were differently regulated for biological processes. (E) KEGG pathway analysis of different regulated targets in the transcriptome. Abbreviations: Ctrl, control; CM, conditional medium. *P<0.05, **P<0.01, ***P<0.001.

