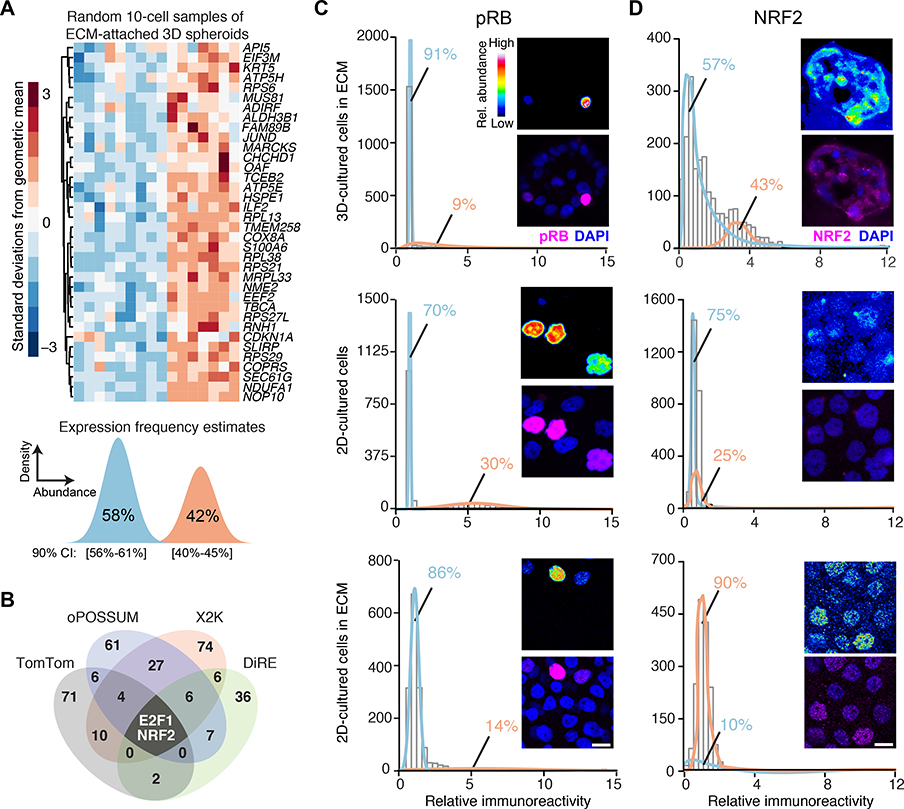
Fig. 1. Transcriptomic fluctuations of ECM-cultured breast epithelial spheroids reveal a gene cluster associated with heterogeneous NRF2 stabilization in a 3D-specific environment.
(A) Maximum-likelihood inference parameterization (lower) of a two-state distribution of transcript abundances for the gene cluster from microarray profiles (upper) of ECM-attached basal-like MCF10A-5E breast epithelial cells, randomly collected as 10-cell pools (n = 16) from 3D-cultured spheroids after 10 days, extracted from (20). Inferred expression frequencies are the maximum likelihood estimate with 90% confidence interval (CI). (B) Venn diagram summarizing the candidate transcription factors predicted from four different bioinformatics algorithms (data file S1). (C and D) Quantitative immunofluorescence of (C) hyperphosphorylated RB (pRB, an upstream proxy of active E2F1) and (D) NRF2 in 3D culture with ECM (upper), 2D culture (middle), and 2D culture with ECM (lower). Expression frequencies for a two-state lognormal mixture model (preferred over a one-state model by F test; p < 0.05) were calculated by nonlinear least squares of 60 histogram bins collected from n = 1100–1600 of cells quantified from 100–200 spheroids from two separate 3D cultures. For each subpanel, representative pseudocolored images are shown in the upper right inset and merged (magenta) with DAPI nuclear counterstain (blue) in the lower right inset. Scale bar is 10 μm.

