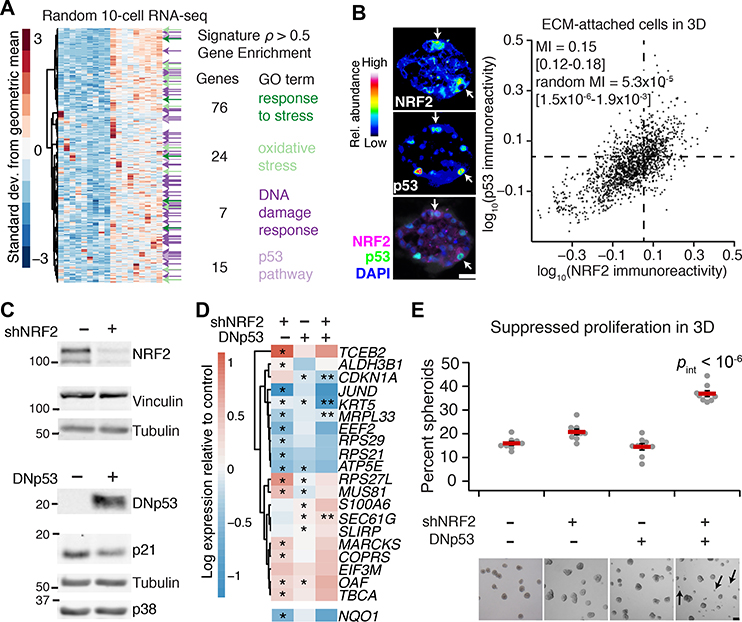
Fig. 2. Transcriptome-wide covariate analysis of the NRF2-associated gene cluster suggests a coordinated adaptive-stress response involving p53.
(A) Transcripts covarying with the median NRF2-associated fluctuation signature (Fig. 1A, upper; 20) measured by 10-cell RNA sequencing (45) of ECM-attached MCF10A-5E cells grown as 3D spheroids (n = 18 10-cell pools from GSE120261). Selected Gene Ontology enrichment analysis (green and purple) is shown for the transcripts with a Spearman correlation (ρ) greater than 0.5. The complete list of enrichments is available in file S2. (B) Quantitative immunofluorescence of NRF2 and p53 abundance in ECM-attached MCF10A-5E cells grown as 3D spheroids. Representative pseudocolored images for NRF2 (upper left) and p53 (middle left) are shown merged with DAPI nuclear counterstain (lower left). White arrows indicate concurrent NRF2 and p53 stabilization. Median-scaled two-color average fluorescence intensities are quantified (right) along with the log-scaled and background-subtracted mutual information (MI) with 90% CI for n = 1691 cells segmented from 50–100 spheroids from two separate 3D cultures. (C) Genetic perturbation of NRF2 by inducible shRNA knockdown (upper) and p53 by inducible expression of a FLAG-tagged carboxy terminal (residues 1–13, 302–390) dominant-negative p53 (DNp53, lower). NRF2 knockdown reduced NRF2 protein abundance to 22 ± 4% of control knockdown (fig. S3B). MCF10A-5E cells were treated with 1 μg/ml doxycycline for 72 (upper) or 24 (lower) hours and immunoblotted for NRF2 or FLAG with vinculin, tubulin, and p38 used as loading controls and p21 used to confirm efficacy of DNp53. The negative control for shNRF2 was an inducible shGFP, and the negative control for DNp53 was an inducible FLAG-tagged LacZ. (D) Abundance changes in the gene cluster after single and combined perturbations of NRF2 and p53. NQO1 was used as a control for efficacy of shNRF2, and CDKN1A shows efficacy of DNp53. MCF10A-5E cells with or without NRF2 knockdown or DNp53 were treated with 1 μg/ml doxycycline for 48 hours, grown as 3D spheroids for 10 days, and profiled for the indicated genes by quantitative PCR. Data are log2 geometric mean relative to the negative control (shGFP + FLAG-tagged LacZ), with asterisks indicating significant changes (left and middle columns) or interaction effects (right column) by two-way ANOVA of n = 8 independent 3D-cultured samples and a false-discovery rate of 5%. The complete set of transcripts in the gene cluster is shown in fig. S2C. (E) Dual inactivation of NRF2 and p53 causes synergistic proliferative suppression in MCF10A-5E 3D spheroids. Black arrows indicate proliferation-suppressed spheroids. Data are mean percentage of proliferation-suppressed spheroids ± s.e.m. of n = 8 independent 3D-cultured samples after 10 days. Statistical interaction between NRF2 and p53 (pint) was assessed by two-way ANOVA with replication. Scale bars are 20 μm (B) and 100 μm (E).

