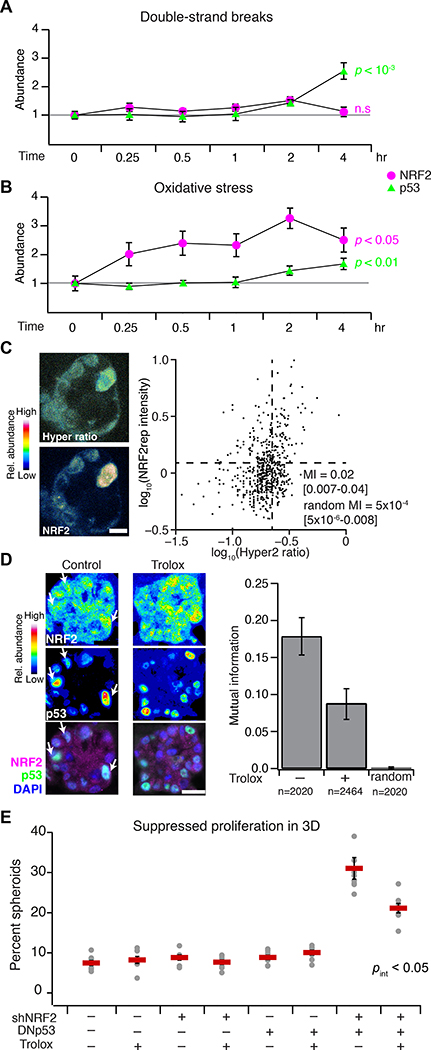
Fig. 4. NRF2–p53 signaling coordination and 3D phenotypes arise from spontaneous and oncogene-induced oxidative stress.
(A and B) NRF2 and p53 stabilization by oxidative stress compared to DNA double-strand breaks. MCF10A-5E cells were treated with 5 μM doxorubicin (double-strand breaks) or 200 μM H2O2 (oxidative stress) for the indicated time points, and NRF2 (magenta) or p53 (green) protein abundance was estimated by quantitative immunoblotting. Data are mean ± s.e.m. of n = 3 (A) or 4 (B) independent perturbations. (C) Endogenous oxidative stress association with NRF2 stabilization in 3D spheroids. MCF10A-5E cells stably expressing HyPer-2 (67) and mRFP1-NRF2 reporter (NRF2rep) were grown as 3D spheroids for 10 days and imaged by laser-scanning confocal microscopy. Representative pseudocolored images for HyPer-2 ratio (upper left) and mRFP1-NRF2 reporter (lower left) are shown. HyPer-2 ratios and mRFP1-NRF2 reporter fluorescence are quantified (right) along with the log-scaled mutual information (MI) with 90% CI for n = 605 cells segmented from 10–25 spheroids from four separate 3D cultures. (D) Suppression of endogenous NRF2–p53 coordination during 3D culture with the antioxidant Trolox. Representative pseudocolored images for NRF2 (upper left) and p53 (middle left) are shown merged with DAPI nuclear counterstain (lower left). White arrows indicate concurrent NRF2 and p53 stabilization. The log-scaled and background-subtracted MI (right) is shown with 90% CI estimated from n = 1000 bootstrap replicates. (E) Trolox interference with the synergistic proliferative suppression caused by dual inactivation of NRF2 and p53 in MCF10A-5E cells. Data are mean percentage of proliferation-suppressed spheroids ± s.e.m. of n = 8 independent 3D-cultured samples after 10 days. The overall effect of Trolox on spheroid size is shown in fig. S10. Statistical interaction between Trolox and NRF2–p53 (pint) was assessed by three-way ANOVA with replication. For (A) and (B), change in protein abundance over time was assessed by one-way ANOVA. For (D) and (E), MCF10A-5E cells cultured for 10 days in 3D with or without 50 μM Trolox supplemented every two days. Scale bars are 10 μm (C) and 20 μm (D).

