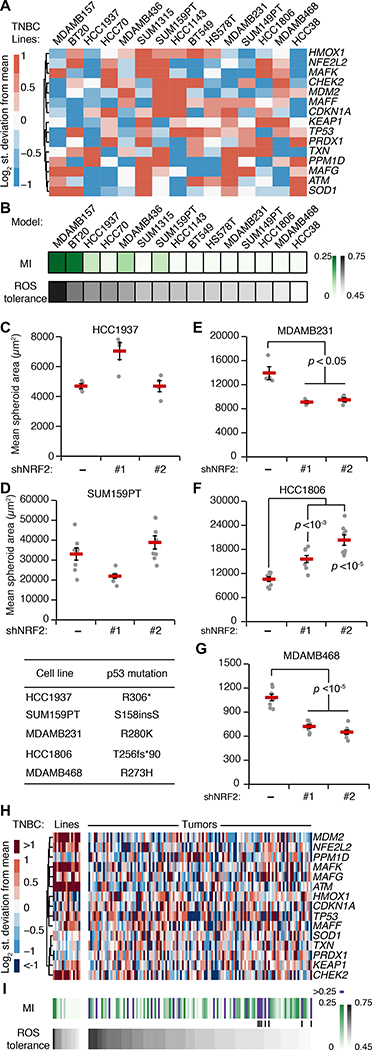
Fig. 7. TNBC-specific signatures of the oxidative-stress network predict NRF2–p53 coupling and the response to NRF2 perturbations.
(A) Transcripts per million for the indicated TNBC cell lines scaled to MCF10A cells from the NIH LINCS dataset (91). (B) NRF2–p53 mutual information (MI) and ROS tolerance for TNBC cell lines using the simulation strategy in Fig. 5B. (C to G) Quantification of mean spheroid area with or without NRF2 knockdown in 3D-cultured TNBC cells with higher simulated ROS tolerance and NRF2–p53 MI (C and D) and with lower simulated ROS tolerance and NRF2–p53 MI (E to G). (H) Transcripts per million for the TNBC lines in (A) scaled to clinical cases of TNBC in TCGA (35). (I) Simulated NRF2–p53 MI and ROS tolerance for TNBC tumors. Vertical lines indicate cases with high MI in the lower quartile of ROS tolerance. For (A) and (H), the clustered transcripts were used to adjust the initial conditions of the model simulations for each cell line and tumor. For (B) and (I), ROS tolerance was defined as the integrated intracellular H2O2 concentration in each cell line compared to that of MCF10A-5E cells in response to an increased ROS production rate as in Fig. 5B. For (C) to (G), TNBC cells with or without inducible NRF2 knockdown were treated with 1 μg/ml doxycycline for 72 hours, grown as 3D spheroids, imaged by brightfield microscopy, and segmented. Data are mean ± s.e.m. of n = 4–8 biological replicates. The difference between means was assessed by Student’s t test with Šidák correction for multiple-hypothesis testing, and the specific p53 mutation of each line is shown (lower left).

