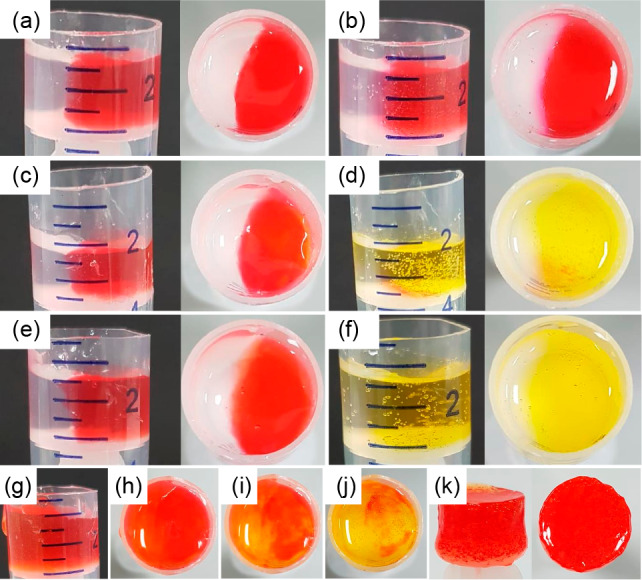
Figure 6.

Controlling diffusion in gels. (a) Two hemispheres prepared from gels formed from 1 with no enzyme present do not evolve with time. After 1 h, limited diffusion of the dye (methyl red) trapped in one gel to the other is observed (b). Where the enzymatic trigger (using 100 μL of methyl formate) is incorporated in the right-hand gel (c) with no trigger in the left-hand gel, diffusion is enhanced by the annealing of this gel (d). Note the color after 1 h is yellow as the pH is still above the pKa of the dye. Where the trigger is incorporated in both sides of the gel (e), mixing is further enhanced after 1 h (f). When different amounts of trigger are incorporated in both hemispheres (g), incorporation of the dye allows this to be visualized. (g, h) show the gels immediately after formation, (i) shows the gels after 1 min, and (j) shows the gels after 3 min. The red to orange color is more apparent in the left-hand side which has the higher amount of trigger. After annealing, the gels can be removed from the mold; (k) shows the gel in (h) after 16 h. For these images, gels at a concentration of 1 of 2 mg/mL were used. Methyl red (0.05 mg/mL) is used to dye the gels. For (e) and (g), volumes of methyl formate used are 100 and 150 μL for left and right hemispheres, respectively. For (c), (e), and (g), the initial concentration of urease is 0.2 mg/mL, and urea is 0.02 M.
