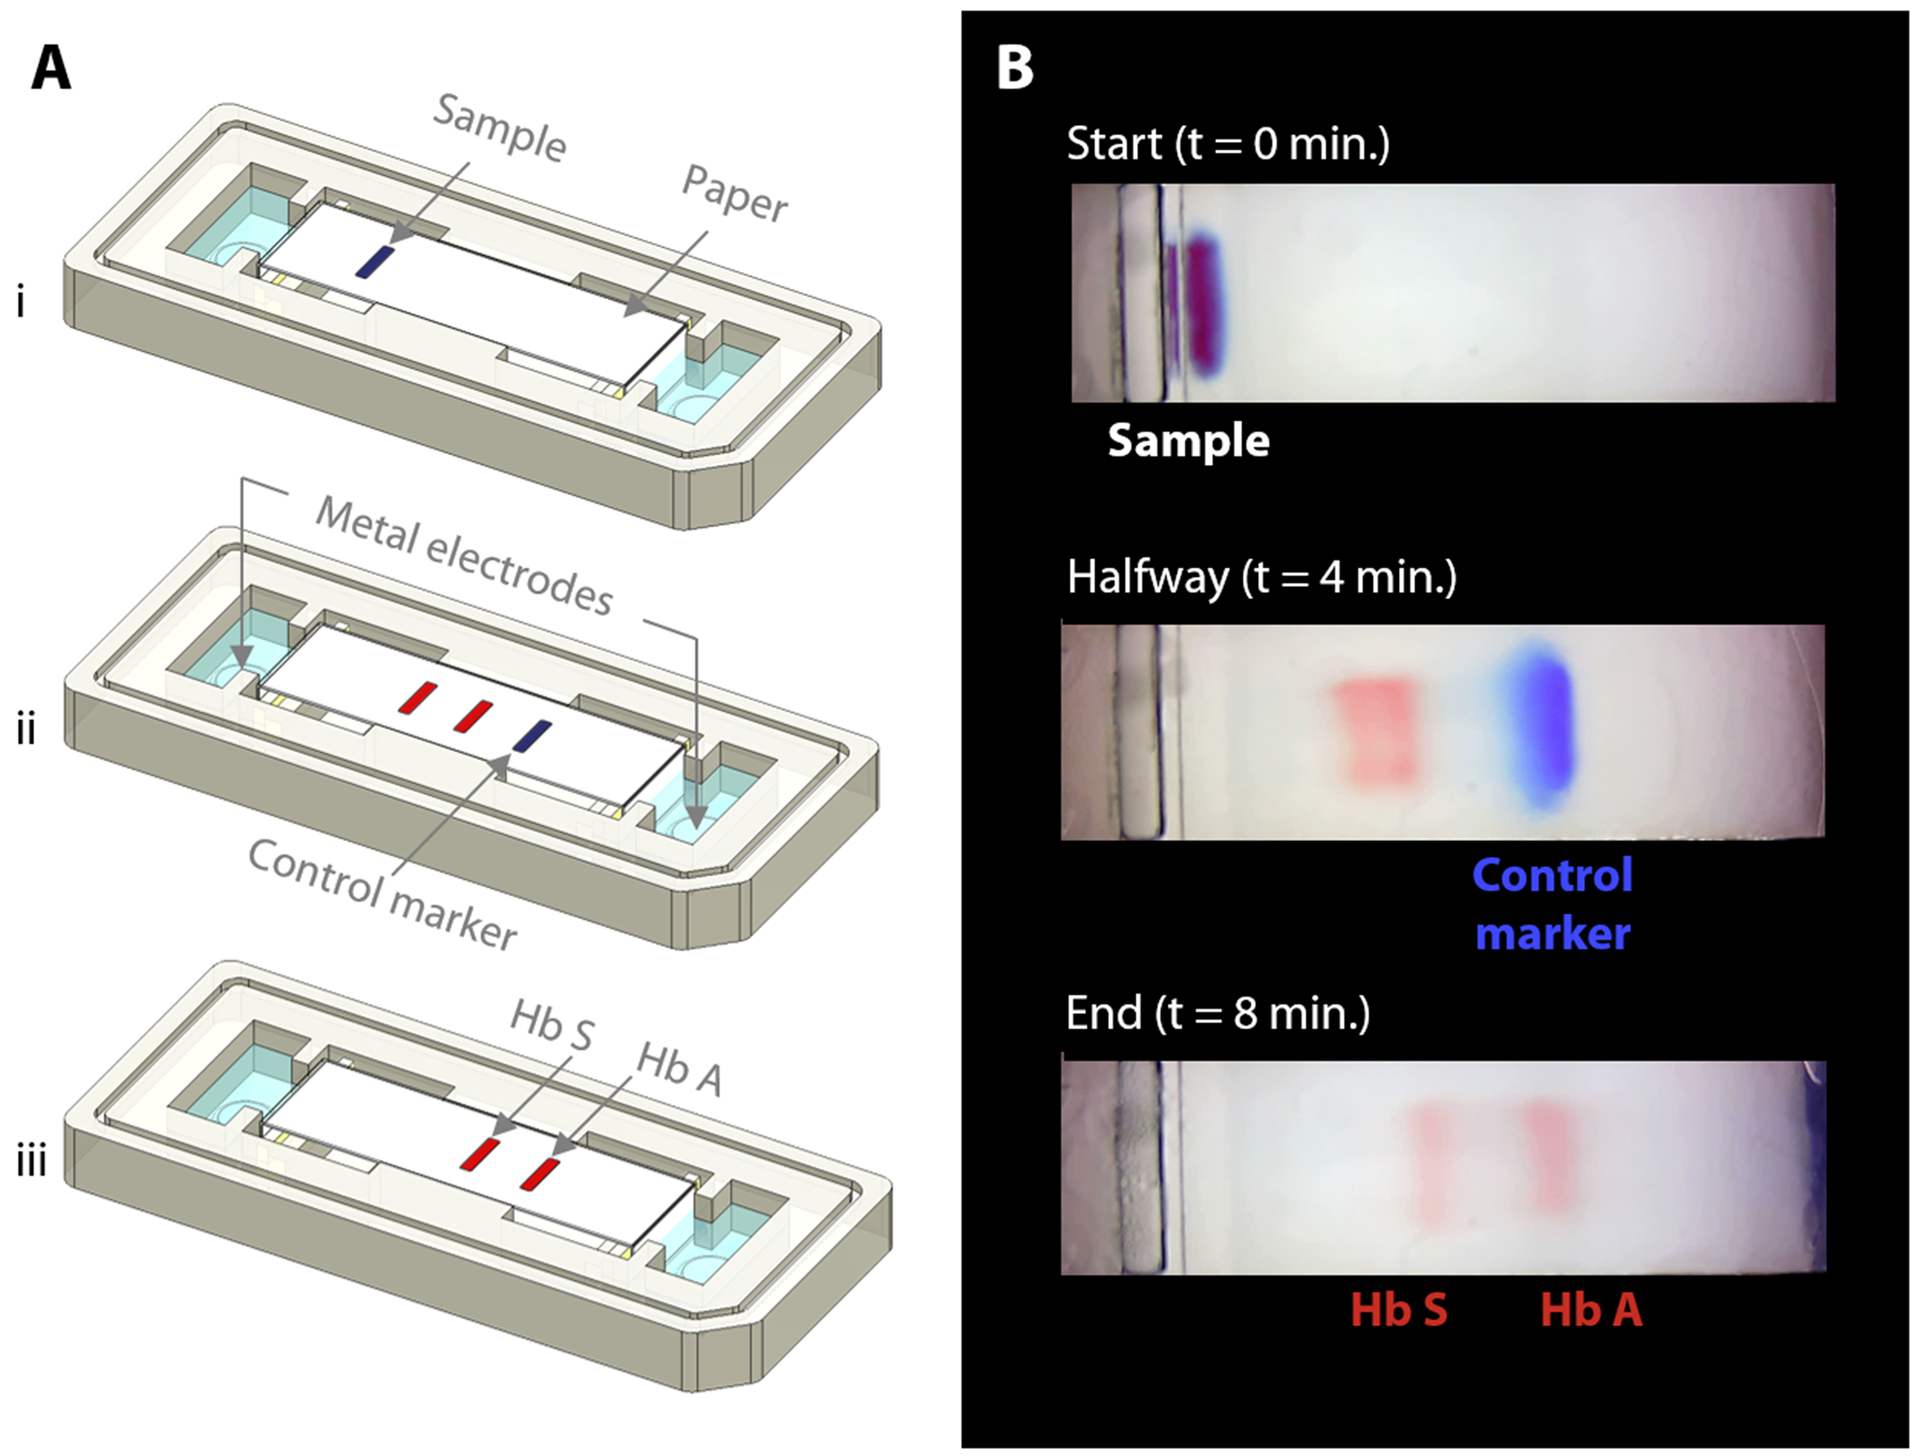
Fig. 2. Overview of HemeChip operation and hemoglobin variant separation with a control marker.

(A) Schematic illustration of hemoglobin separation and the blue control marker (xylene cyanol) migration in HemeChip. (i) Beginning of the test is shown with blood sample and marker mixture applied. (ii) Hemoglobin bands and the control marker start migrating. Migration of the blue control marker is used image processing algorithm to confirm that the test is running as expected. (iii) Fully separated hemoglobin bands appear at the end of the test. Control marker migrates all the way to the end and leaves the field of view, at which time, hemoglobin bands are imaged and analyzed in their final positions. (B) Time lapse images captured during a HemeChip test demonstrate the separation of hemoglobin A and S bands, and the migration of the control marker.
