
Fig. 4. Real-time imaging, image analysis, and tracking of control marker and hemoglobin bands in HemeChip.
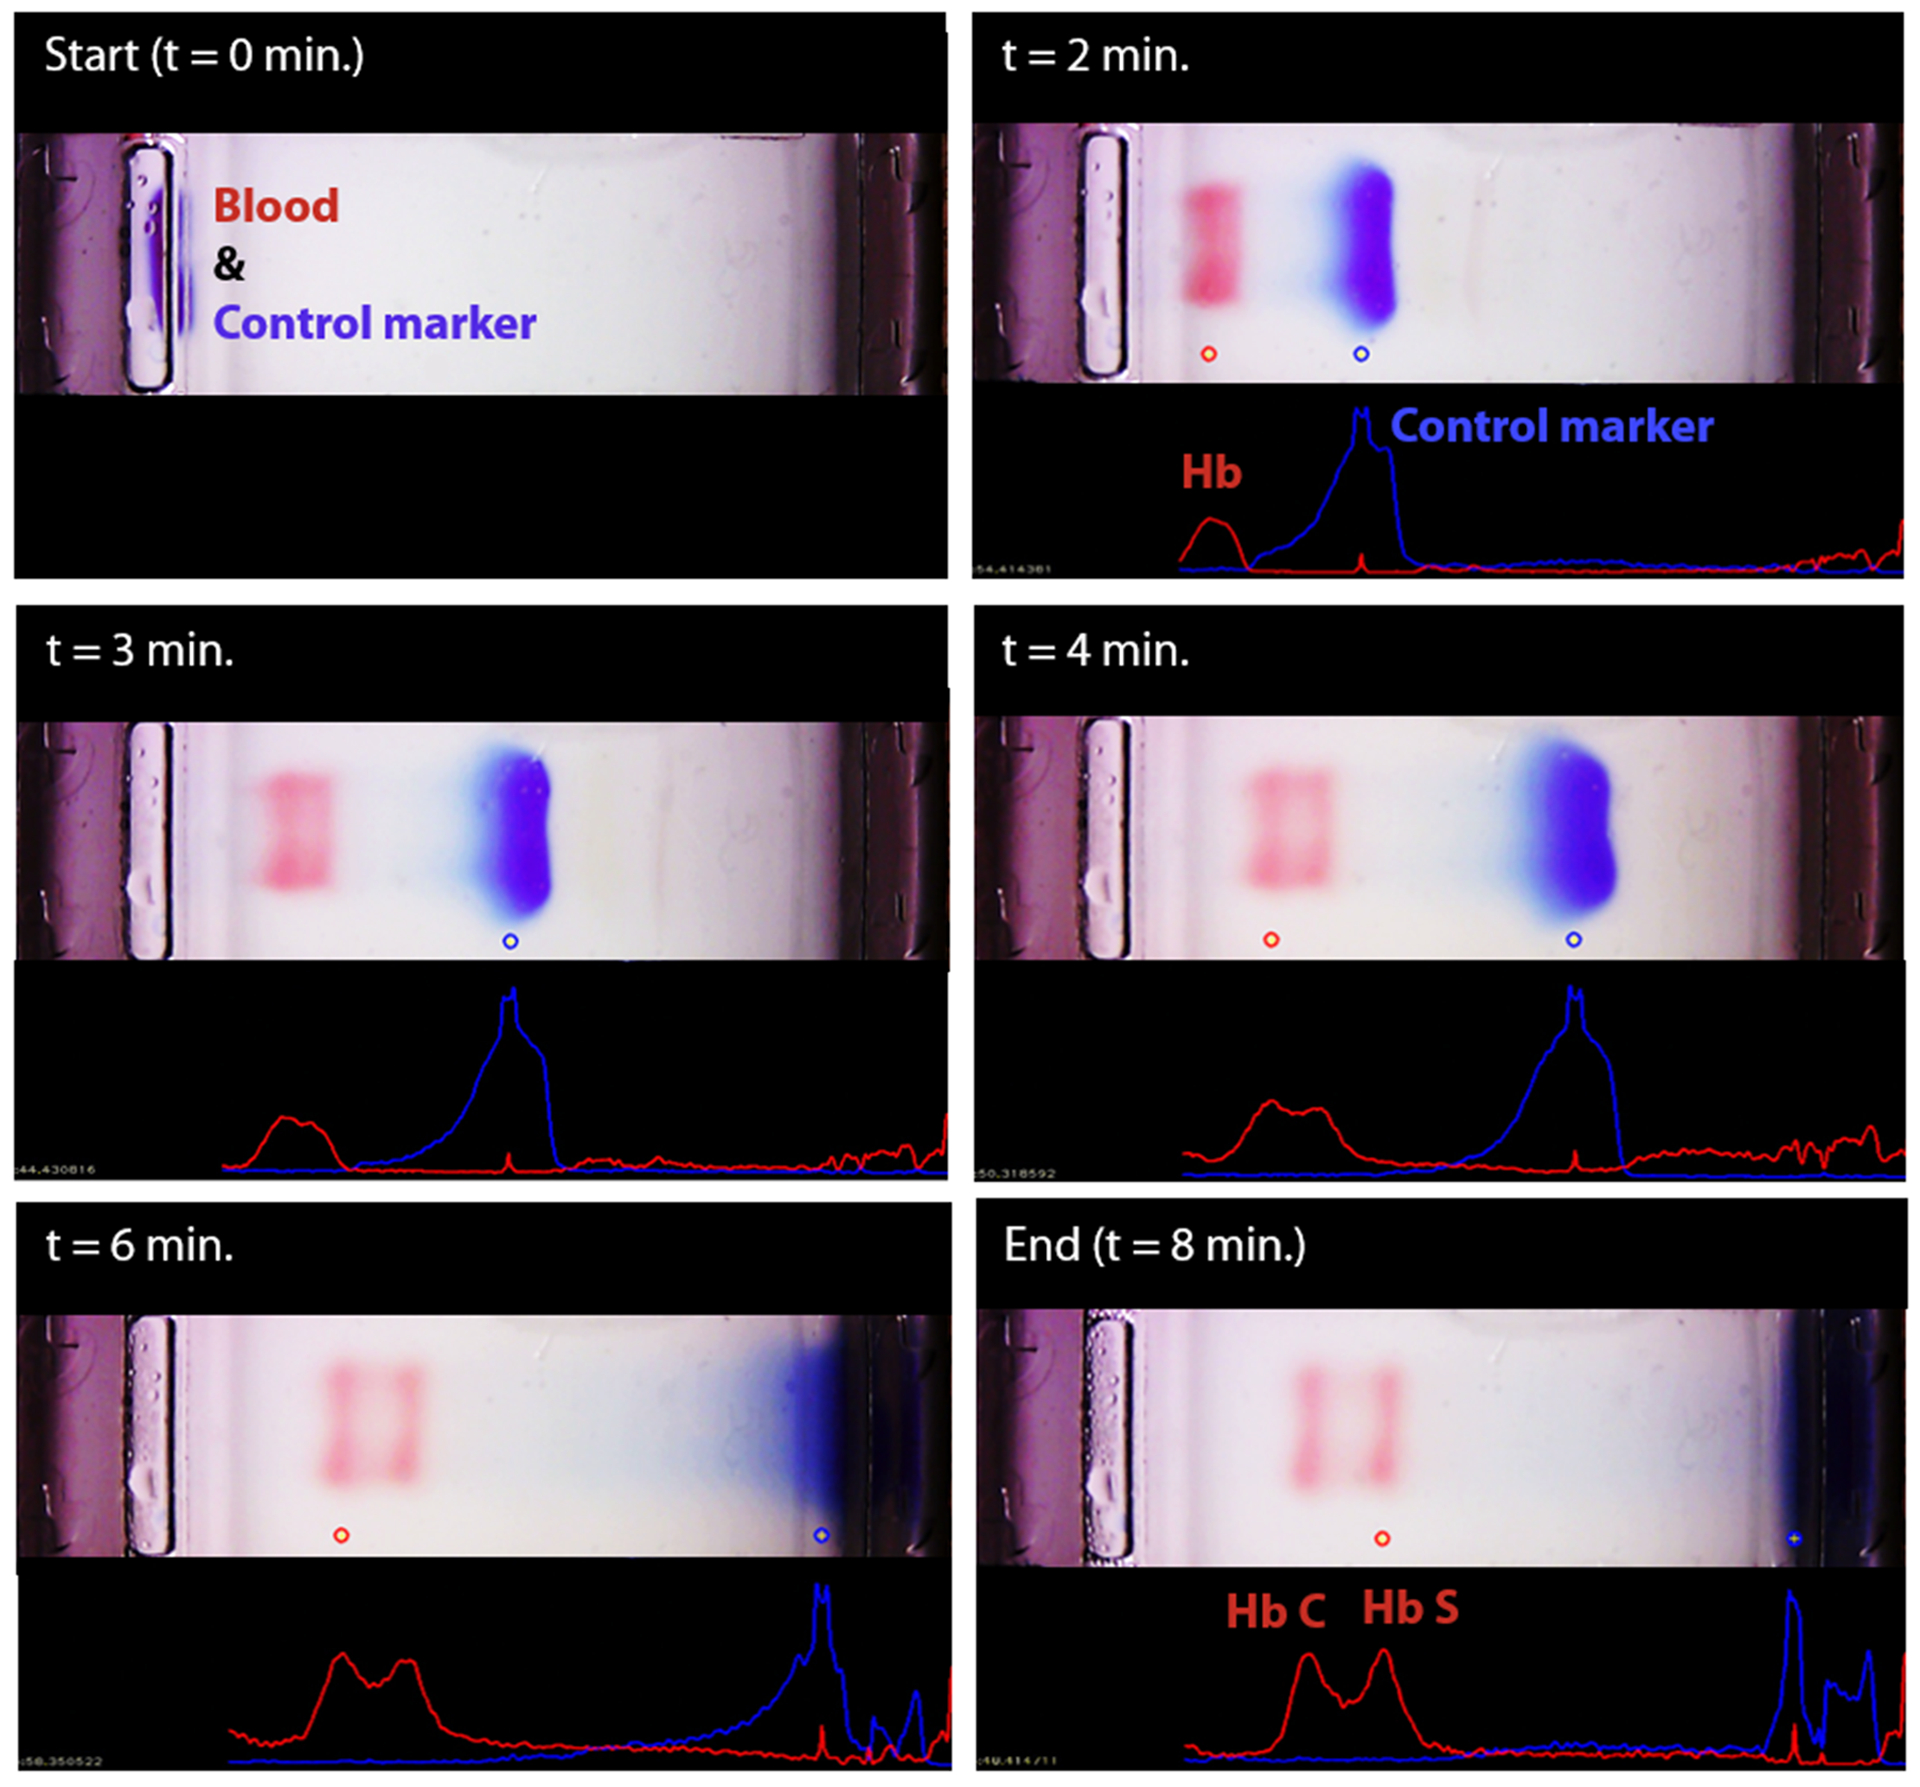
The time-lapse images show the real-time tracking of the blue control marker and hemoglobin bands. Hemoglobin bands, and the control marker are imaged, automatically recognized, and identified. Movement of the control marker is tracked and used to confirm that the test is running as expected. In this example, hemoglobin types S and C were identified by the algorithm.