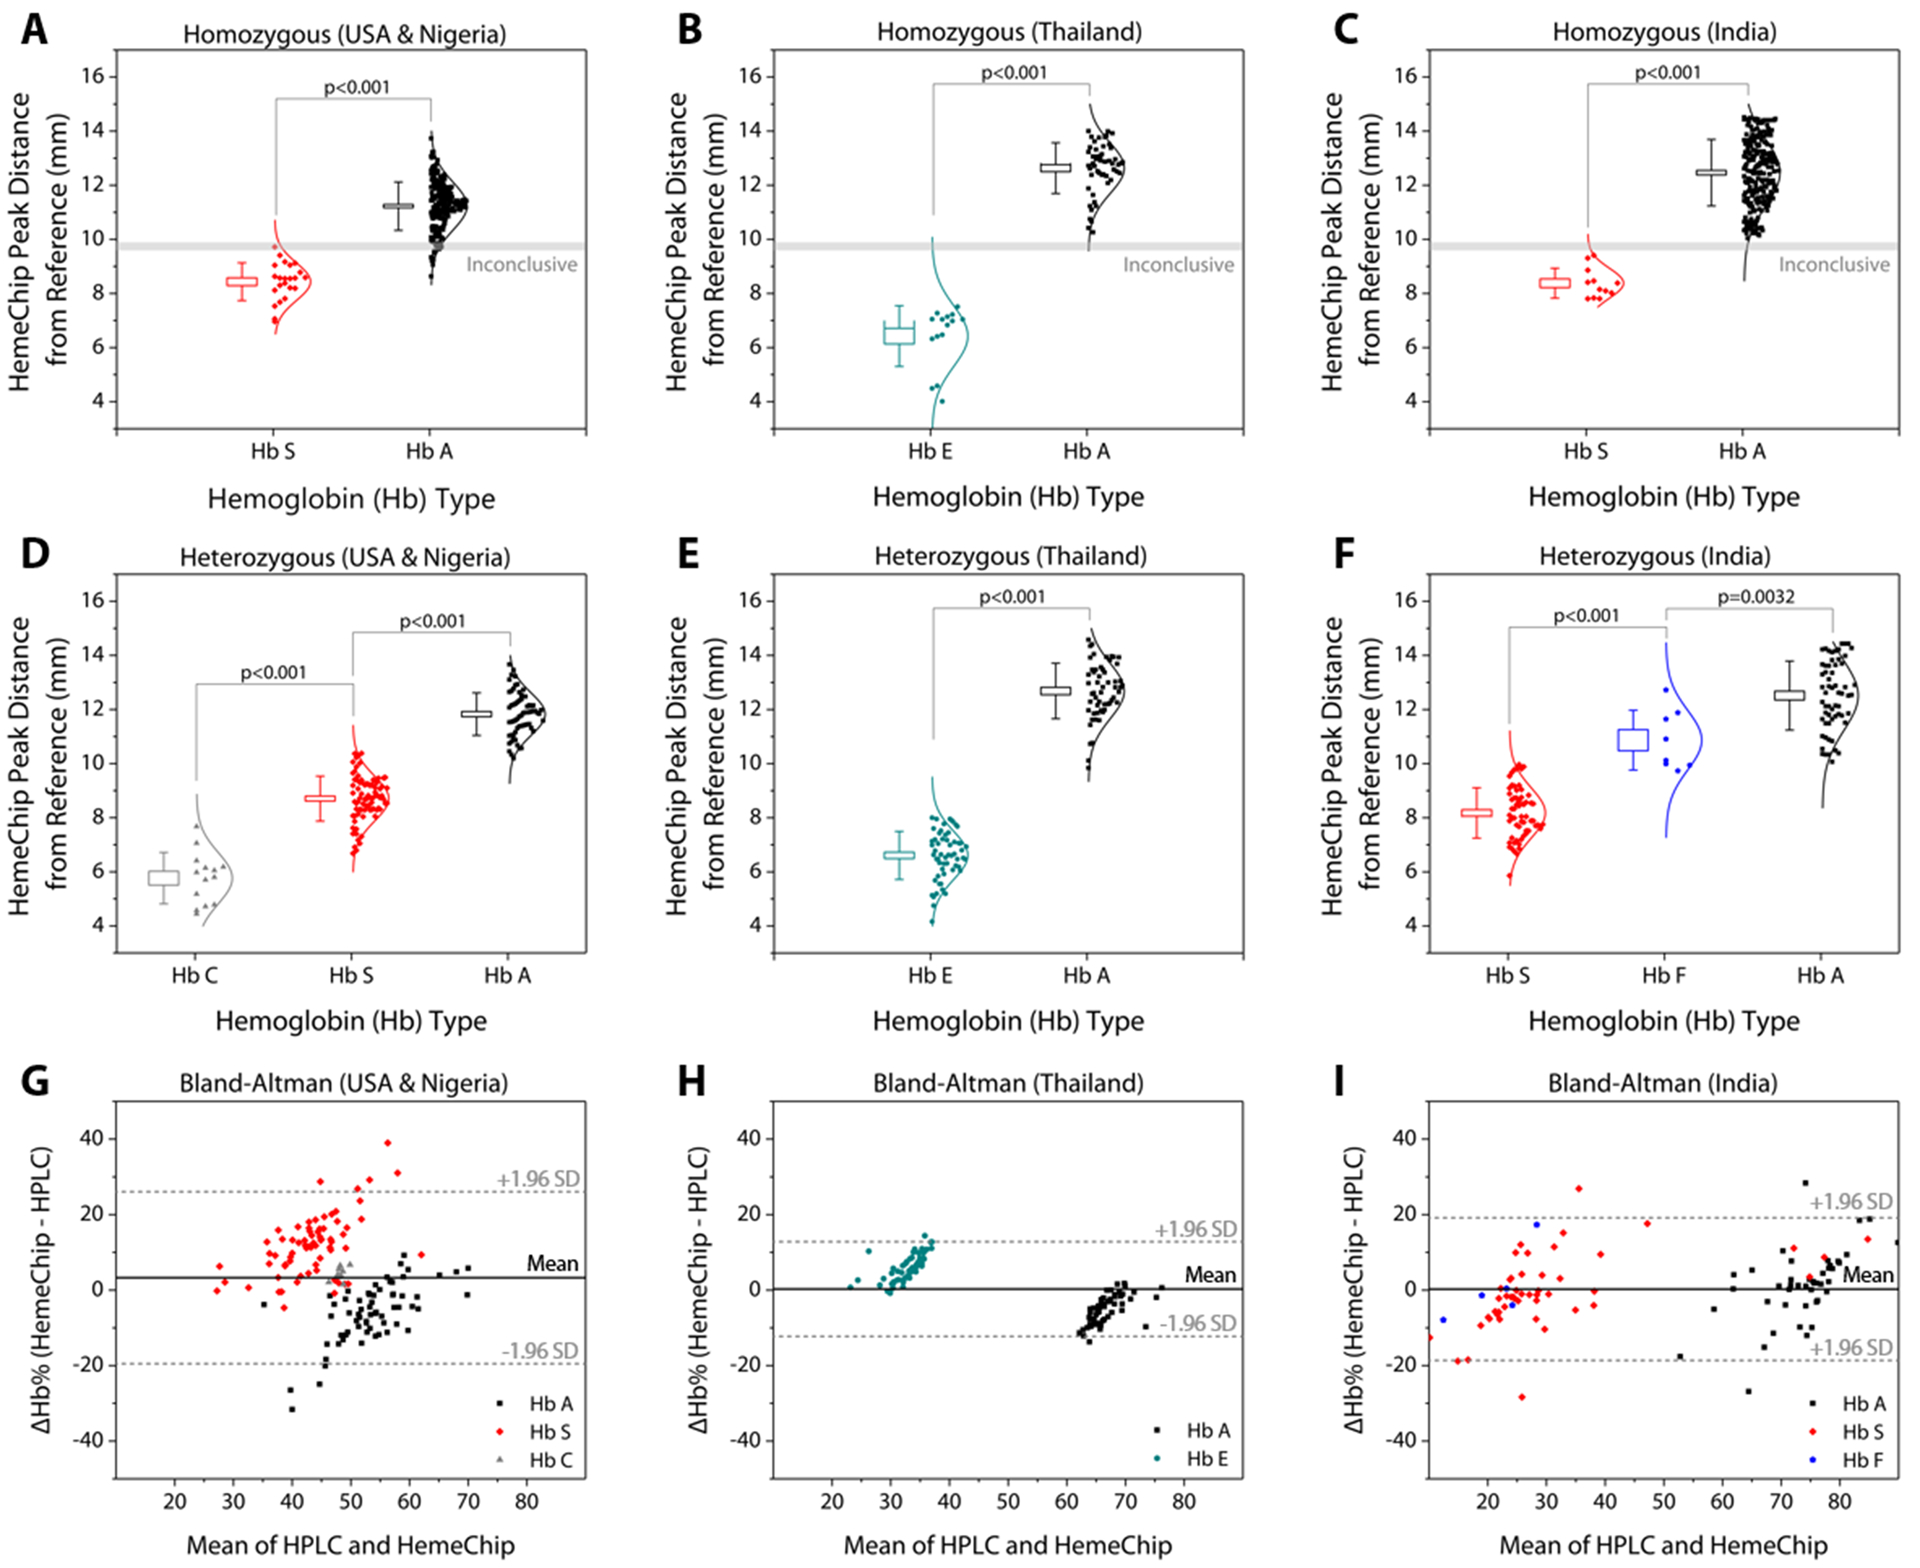
Fig. 6. HemeChip hemoglobin band separation and quantification.

The top row are data distribution plots that show the hemoglobin band separation for homozygous subjects tested in: (A) the USA (9 HbSS) and Nigeria (13 Hb SS, 212 Hb AA), (B) Thailand (15 Hb EE, 50 Hb AA), and (C) India (11 Hb SS, 219 Hb AA). The middle row are data distribution plots for heterozygous subjects tested in: (D) the USA (7 Hb AS, 14 Hb SC) and Nigeria (60 Hb AS), (E) Thailand (57 Hb AE), and (F) India (60 Hb AS, 7 Hb SF, 1 Hb AF). The horizontal lines between hemoglobin positions represent statistically significant differences based on one-way Analysis of Variance (ANOVA) with Tukey post-hoc test for multiple comparisons, where applicable. In whisker plots, brackets represent standard deviation of the mean, and boxes represent standard error of the mean. Lower row are Bland-Altman analysis plots comparing HemeChip with reference standard method (HPLC) for hemoglobin percentage quantification for the heterozygous subjects tested in the USA and in Nigeria (G), Thailand (H), and India (I). In Bland-Altman plots, solid line indicates the mean difference and dashed lines indicate 95% limits of agreement defined as mean difference ± 1.96 times standard deviation (SD). HemeChip reports hemoglobin C/E/A2. Test location was used to differentiate co-migrating hemoglobins C and E.
