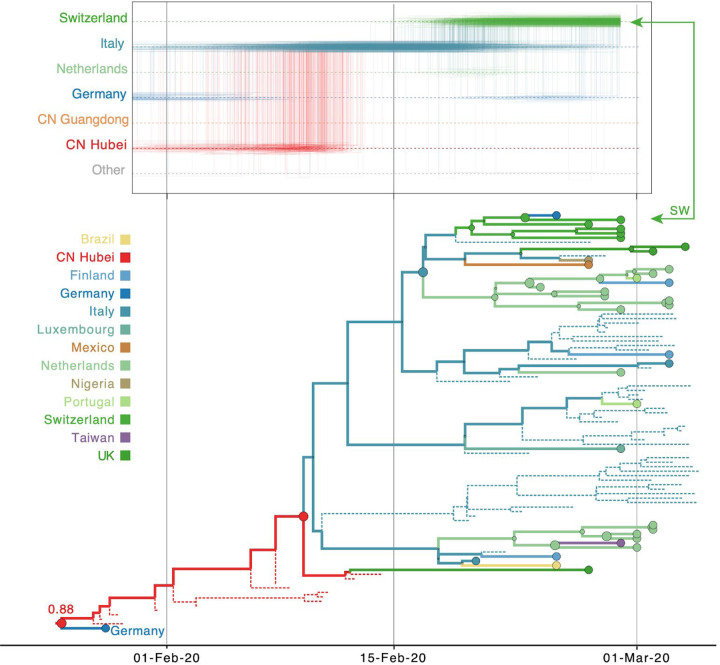
Figure 7:
Markov jump trajectory plot as in Fig. 5 for a Swiss genome (EPI_ISL_413021) in lineage B1 and B1 subtree for the Bayesian phylogeographic analysis incorporating travel data Fig. 7 and unsampled diversity. Dotted lines represent branches associated with unsampled taxa assigned to Italy and Hubei, China. The tip for the Swiss genome corresponding to the trajectory is indicated with an arrow. Because of the color similarity between Italy and Germany, the basal German virus is labeled. The value at the root represents the posterior location state probability.

