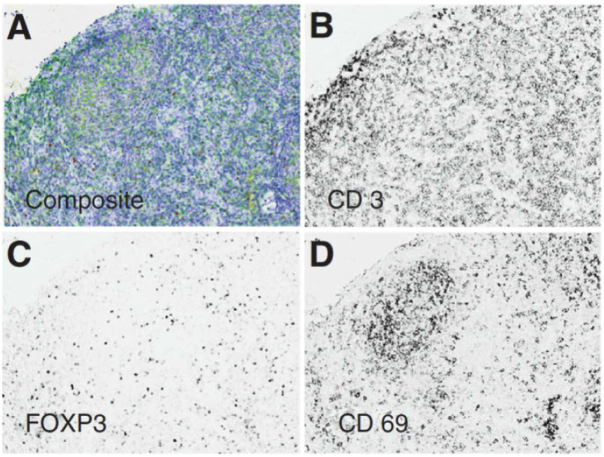
Fig. 3.
Multiple IHC markers in one tissue specimen of follicular lymphoma. MS images acquired using the Vectra system and software for spectrally unmix each IHC stain component. (a) Triplex IHC composite image. (b-d) Spectral-unmixed grayscale images of IHC for CD3, FOXP3, and CD69, respectively. Reproduced from [107]; Creative Commons BY 4.0; published by Nature (2015).

