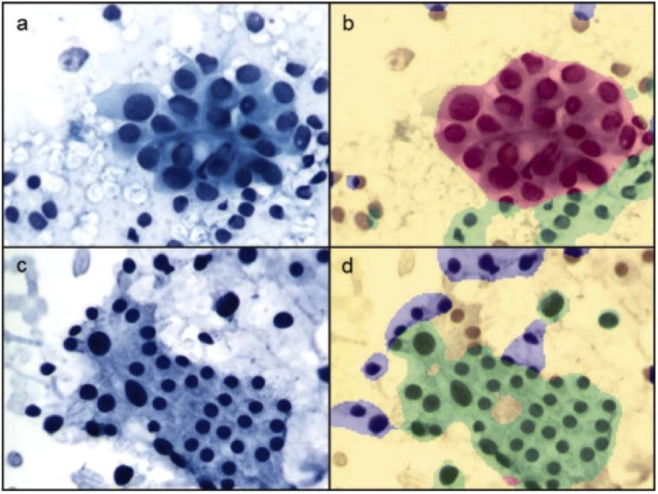
Fig. 5.
Thyroid FNA biopsies with Papanicolaou stain in RGB (left) and classification results with MSI spectral unmixing (right). (a,b) case of PTC. (c,d) case of benign goiter. Background (yellow), PTC (red), benign goiter (green), out-of-focus or crowded areas (blue). Reproduced from [166]; Creative Commons BY 4.0; published by ACS (2012).

