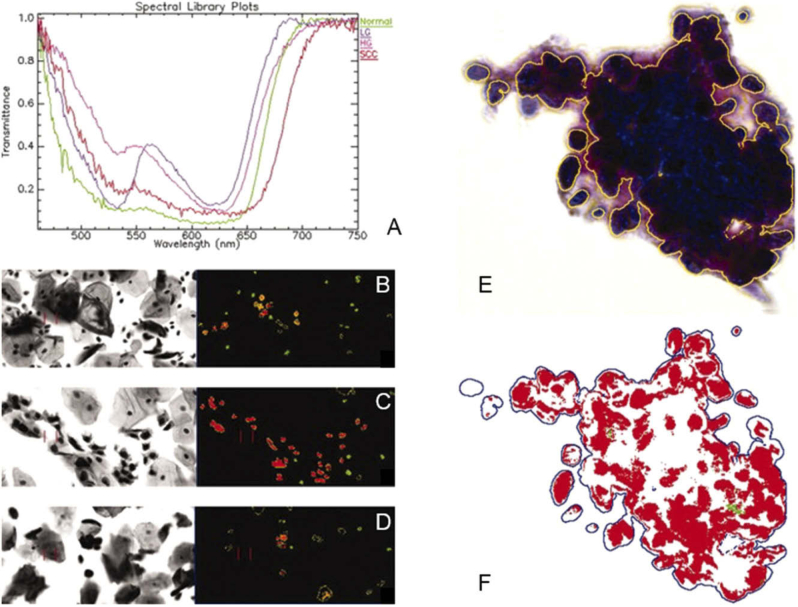
Fig. 8.
(a) Spectral plots of Papanicolaou-stained cells from cervical Pap smear: normal, low-grade (LG), high-grade (HG) and squamous cell carcinoma (SCC). (b-d) Classified HS images of normal (green), LG (yellow), and HG/SCC (red) cells. (e-f) RGB image with annotation of cervical SCC (e) and HS results of the automatically extracted and classified HG/SCC nuclei (f). Reproduced from [207]; Creative Commons BY 4.0; published by ACS (2008).

