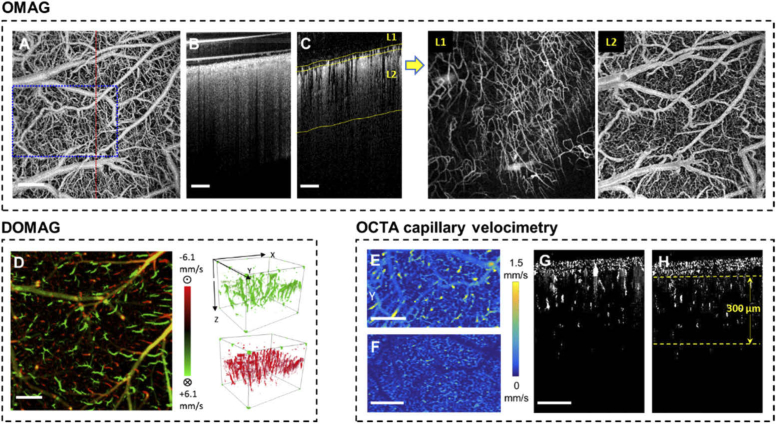
Fig. 3.
A) En face maximum intensity projection (MIP) of the full-depth 3D OMAG dataset acquired in the awake mouse during resting state on Day 14 after the cranial window surgery. B) Cross section of the OCT structure in the red-dashed line position in A. (C) Cross section of the OMAG blood flow with yellow segmentation line for L1 and L2. The new en face images of the two segmented layers are shown to the right. D) Bi-directional axial velocity map generated by en face MIP of the 3D DOMAG dataset. Color bar represents RBC axial velocity of the flow descending (positive, green) and rising from (negative, red) the cortical surface in a range of ±6.1 mm/s. The 3-D velocity signals are shown to the right of the projection image. E) and F) are showing the en face average intensity projection (AIP) of the 3D capillary velocimetry dataset within 300 µm thickness slab with and without masking, corresponding to their cross sections in G and H, respectively. All scale bars in this figure represent 500 µm.

