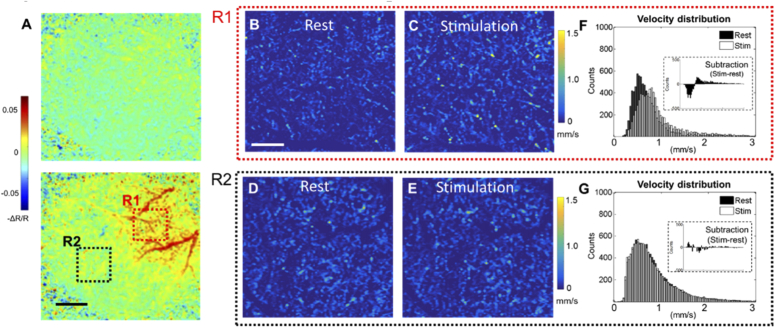
Fig. 4.
A) Wide-field reflectance mapping of the mouse barrel cortex during whisker stimulation achieved with IOSI. Top: 2 sec of data acquisition (no stimulation). Bottom: 15 sec of data acquisition (5 sec of whisker stimulation). R1 indicate an activation of hemodynamic response during whisker stimulation, and R2 is a control region with no response observed. Scale bar represents 1 mm. B)-E) are en face AIP images of the 3D velocimetry dataset at two regions during different states. Images are produced within 300 µm thickness slab after masking out large vessels, the remaining capillary velocity signals are plotted with histogram distributions for F (R1) and G (R2). Insets in the distribution histogram indicate the subtraction from stimulation to rest. Scale bar for velocimetry maps represents 200 µm.

