Fig. 5.
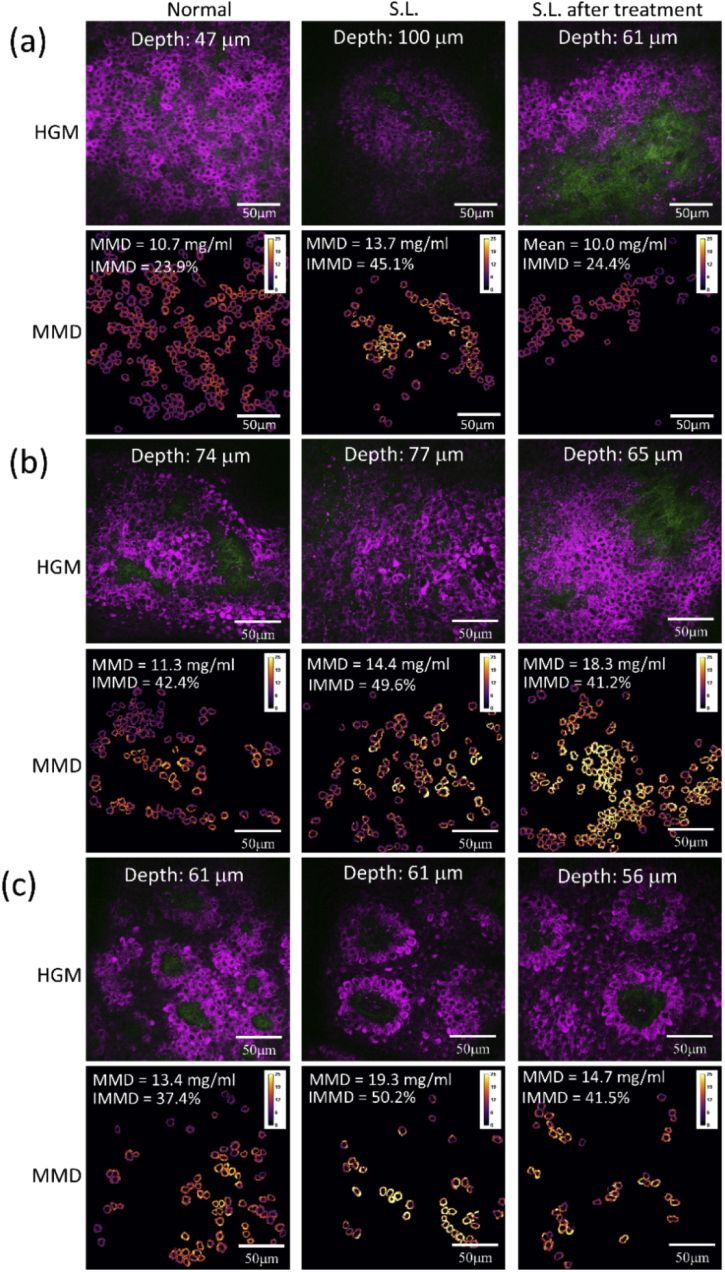
Assessing the laser treatment of Solar Lentigine. (a), (b), (c). The representative in vivo HGM images acquired at the facial skins of the normal region before laser treatment, the lesioned region before laser treatment, and the lesioned region after laser treatment of three patients. Slide-free images were en face optically sectioned. The corresponding MMD distribution images inside the cytoplasm of basal cells at the DEJ are also provided. In some cases, increased MMD mean value in lesion was observed after the laser treatment. It is noted that low THG intensity in deep layers might not correspond to low melanin density. Epi-SHG and epi-THG are represented by green and magenta pseudo-colors. MMD distribution image is color coded. Imaging depths beneath the skin surface, MMD mean, and IMMD values of the images are provided.

