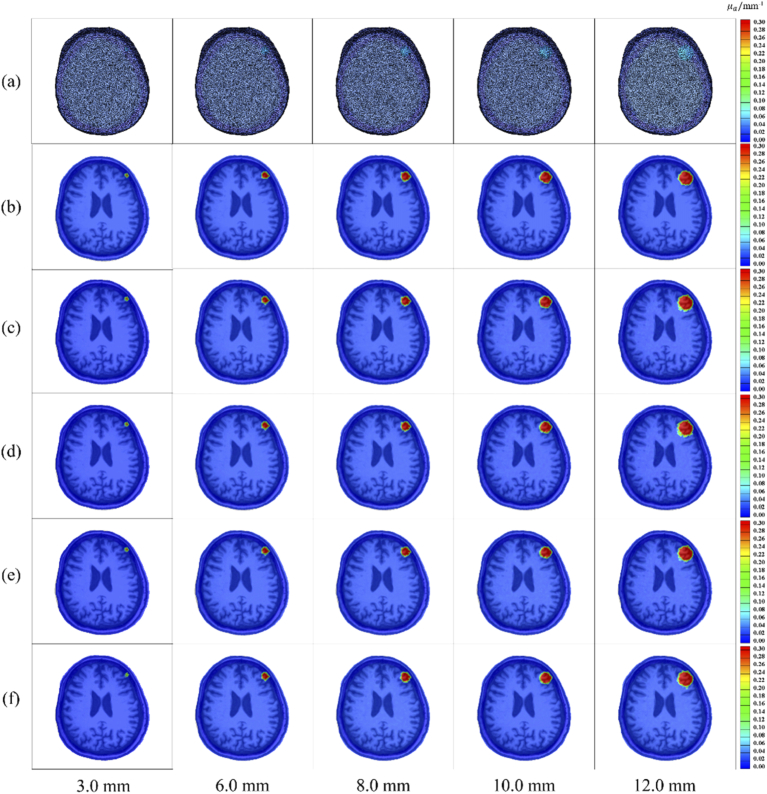
Fig. 7.
Reconstruction effect of SAE network under different SNRs. (a) 3D visualization images of a real cerebral subdural hematoma; (b) slice images of real cerebral subdural hematomas; (c) cerebral subdural hematoma slice images reconstructed with 50 dB SNR; (d) cerebral subdural hematoma slice images reconstructed with 40 dB SNR; (e) cerebral subdural hematoma slice images reconstructed with 30 dB SNR; (f) cerebral subdural hematoma slice images reconstructed with 20 dB SNR.

