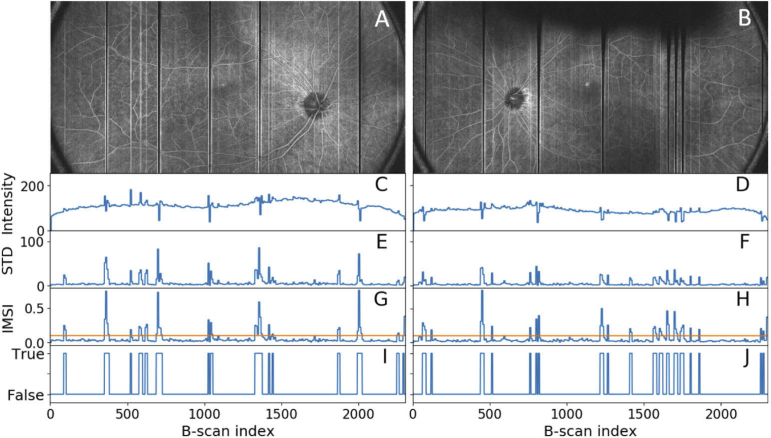
Fig. 2.
(A, B) En face OCTA images acquired from a healthy volunteer without the motion correction system engaged; (C, D) mean values from each OCTA batch; (E, F) standard deviation (STD) between B-frames in each batch; (G, H) IMSI calculated using the en face OCTA image, with yellow line indicating the threshold; (I, J) motion trigger signal generated after the threshold applied to the IMSI value.

