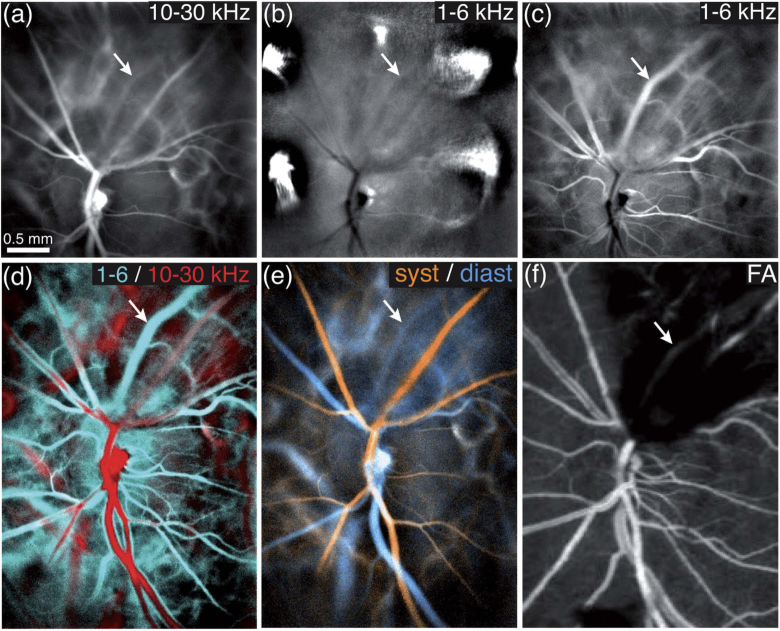
Fig. 4.
Imaging blood flow in a case of retinal vein occlusion. (a) The 10-30 kHz power Doppler image does not show blood flow in the occluded vein. (b) the 1-6 kHz range fails to reveal it because of eye motion. (c) With a SVD filtering the blood flow at low frequency can be revealed. (d) Composite image of the low/high flow in cyan/red; the occluded vessel (arrow) can be easily identified. (e) Composite image of the systole/diastole in orange/blue. (f) Fluorescein angiography in the same region cannot image through the preretinal hemorrhage.

