
Figure 3. TMEM173-Mediated Coagulation Activation Relies on ER Calcium Release.
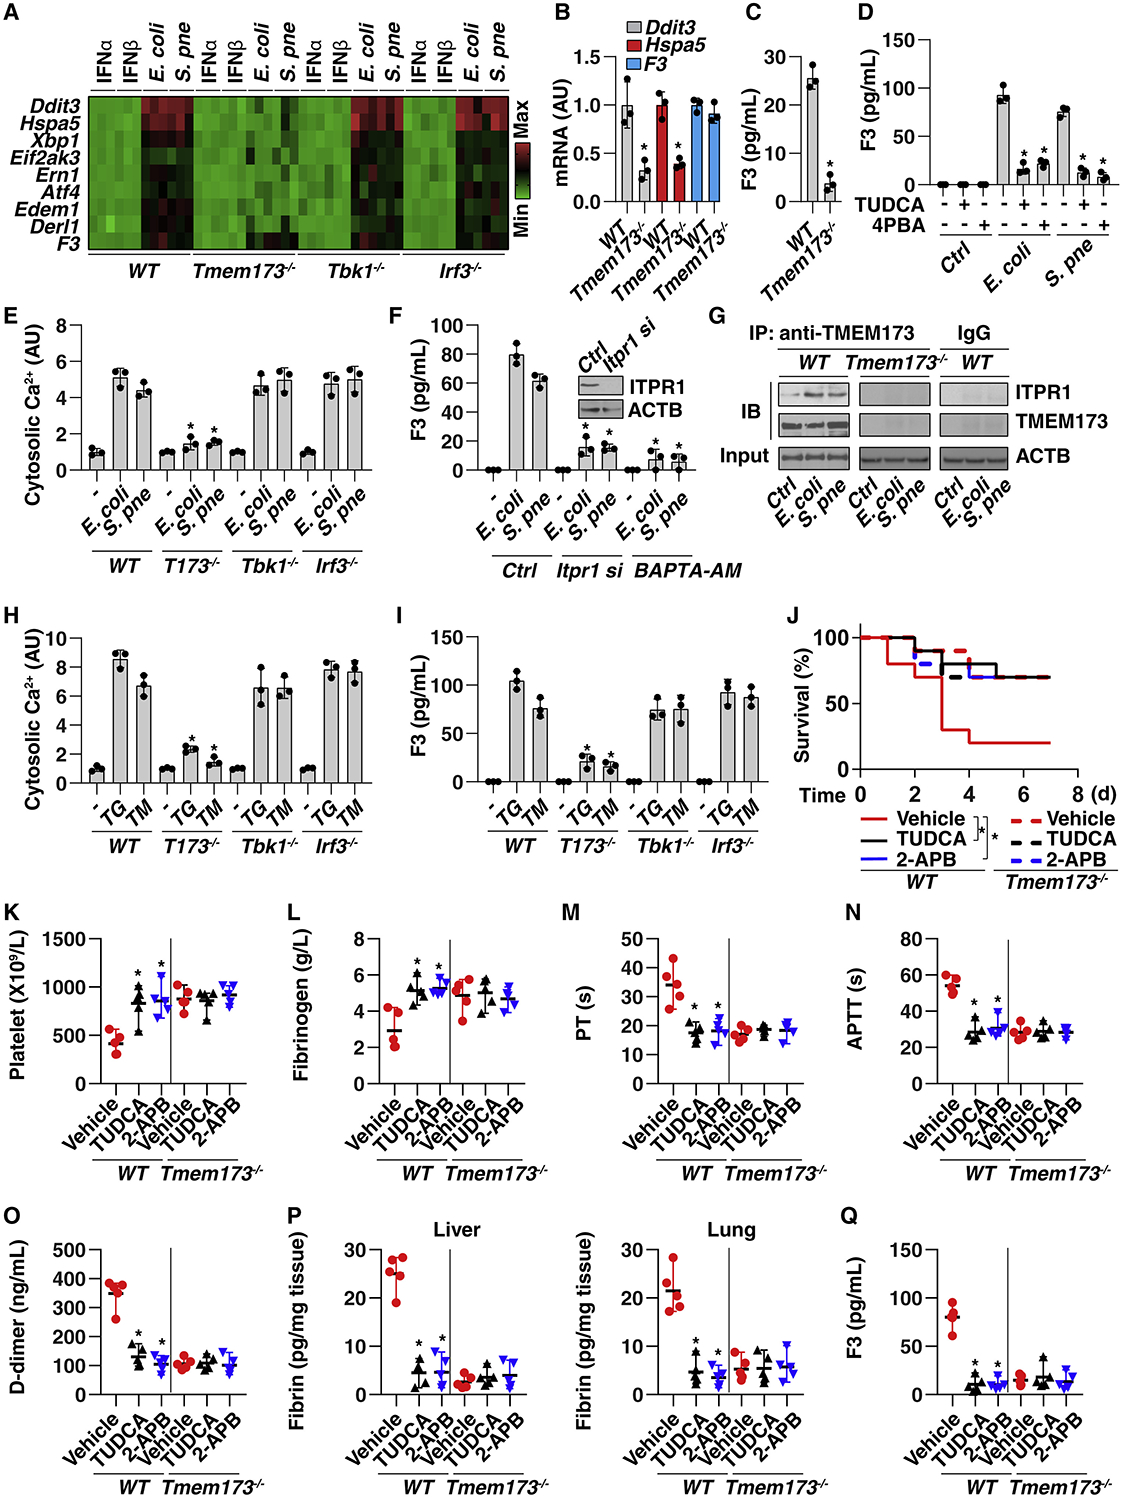
(A) Heatmap of gene mRNA changes in THP1 cells after treatment with IFNα (5 ng/mL), IFNβ (5 ng/mL), E. coli (25 MOI), or S. pneumoniae (25 MOI) infection for 24 h.
(B) Analysis of mRNA expression of the indicated gene in monocytes from CLP-induced (for 48 h) WT or Tmem173−/− mice (n = 3; *p < 0.05 versus WT group, t test).
(C) Analysis of F3 levels in the supernatants of monocytes from CLP-induced (for 48 h) WT or Tmem173−/− mice (n = 3 mice per group; *p < 0.05 versus WT group, t test).
(D) Analysis of F3 release in THP1 cells after E. coli (25 MOI) or S. pneumoniae (25 MOI) infection in the absence or presence of TUDCA (50 μM) or 4PBA (1 mM) for 24 h (n = 3 wells per group; *p < 0.05 versus E. coli or S. pneumoniae group, t test).
(E) Analysis of intracellular Ca2+ in indicated THP1 cells after E. coli (25 MOI) or S. pneumoniae (25 MOI) infection for 24 h (n = 3 wells per group; *p < 0.05 versus WT group, t test).
(F) Analysis of F3 release in indicated WT or Itpr1-knockdown THP1 cells after E. coli (25 MOI) or S. pneumoniae (25 MOI) infection in the absence or presence of BAPTA-AM (10 μM) for 24 h (n = 3 wells per group; *p < 0.05 versus control group, t test).
(G) Analysis of TMEM173-ITPR1 interaction by IP in indicated THP1 cells after E. coli (25 MOI) or S. pneumoniae (25 MOI) infection for 24 h.
(H and I) Analysis of intracellular Ca2+ (H) and F3 (I) release in indicated THP1 cells after thapsigargin (“TG,” 1 μM) and tunicamycin (“TM,” 1.0 μg/mL) treatment for 24 h (n = 3 wells per group; *p < 0.05 versus WT group, t test).
(J) Administration of TUDCA (200 mg/kg) or 2-APB (20 mg/kg) prevented CLP-induced animal death in WT mice, but there was no further protective effect for TUDCA and 2-APG in Tmem173−/− mice (n = 10 mice per group; *p < 0.05, Kaplan-Meier survival analysis).
(K–Q) In parallel, the levels of blood markers of DIC ([K]–[O], as in Figures 1B–1F and 2B–2F), tissue fibrin (P), and plasma F3 (Q) were assayed (n = 5 mice per group; *p < 0.05 versus vehicle group, t test).
Data are presented as mean ± SD ([B], [C], [D], [E], [F], [H], and [I]). See also Figure S4.