
Figure 4. ATP2A2-Dependent ER Calcium Uptake Limits TMEM173-Mediated F3 Release.
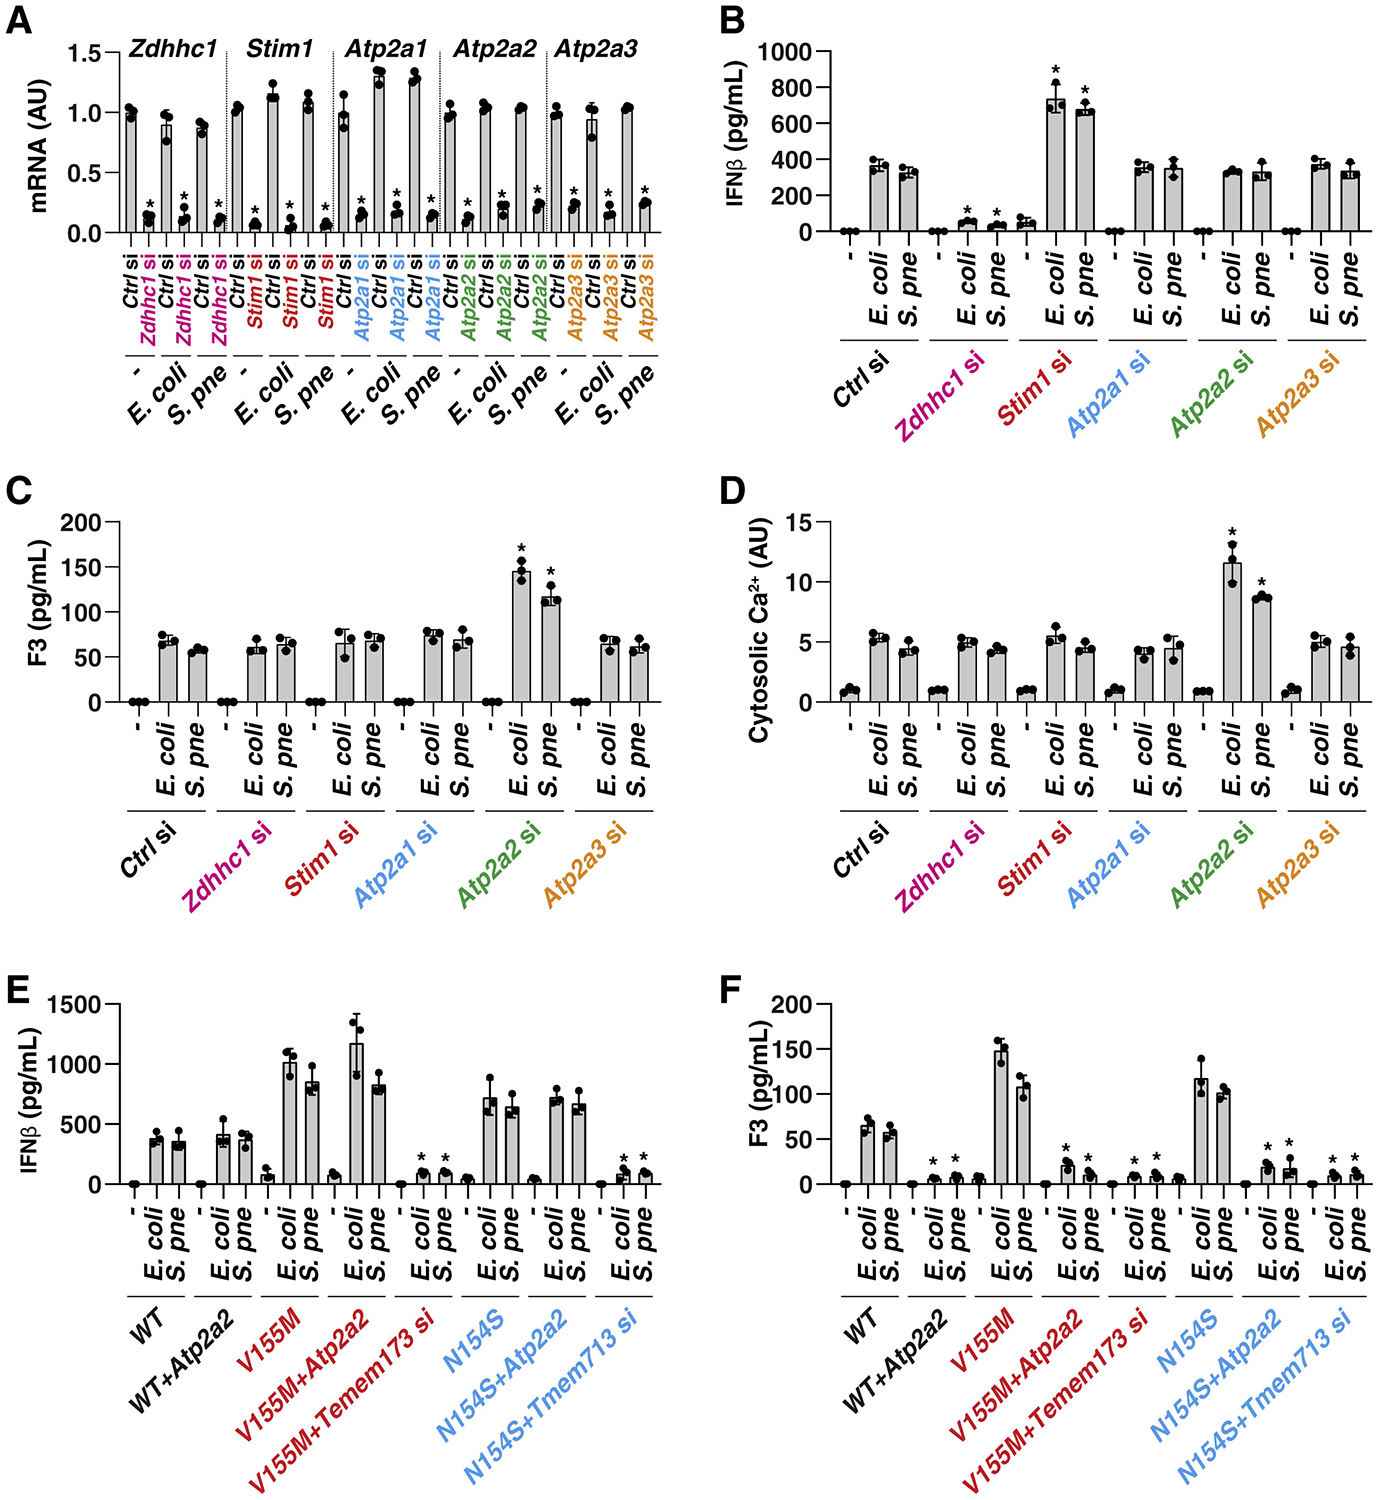
(A) Analysis of gene mRNA expression in indicated gene knockdown THP1 cells after E. coli (25 MOI) or S. pneumoniae (25 MOI) infection for 24 h (n = 3 wells per group; *p < 0.05 versus control siRNA group, t test).
(B–D) Analysis of IFNβ release (B), F3 release (C), and cytosolic calcium (D) in indicated THP1 cells after E. coli (25 MOI) or S. pneumoniae (25 MOI) infection for 24 h (n = 3 wells per group; *p < 0.05 versus control siRNA group, t test).
(E and F) Analysis of IFNβ (E) and F3 (F) release in indicated WT and TMEM173 mutation (V155M and N154S) THP1 cells after E. coli (25 MOI) or S. pneumoniae (25 MOI) infection for 24 h in the absence or presence of Atp2a2 overexpression or Tmem173 knockdown (n = 3 wells per group; *p < 0.05 versus control group, t test). Data are presented as mean ± SD. See also Figure S5.