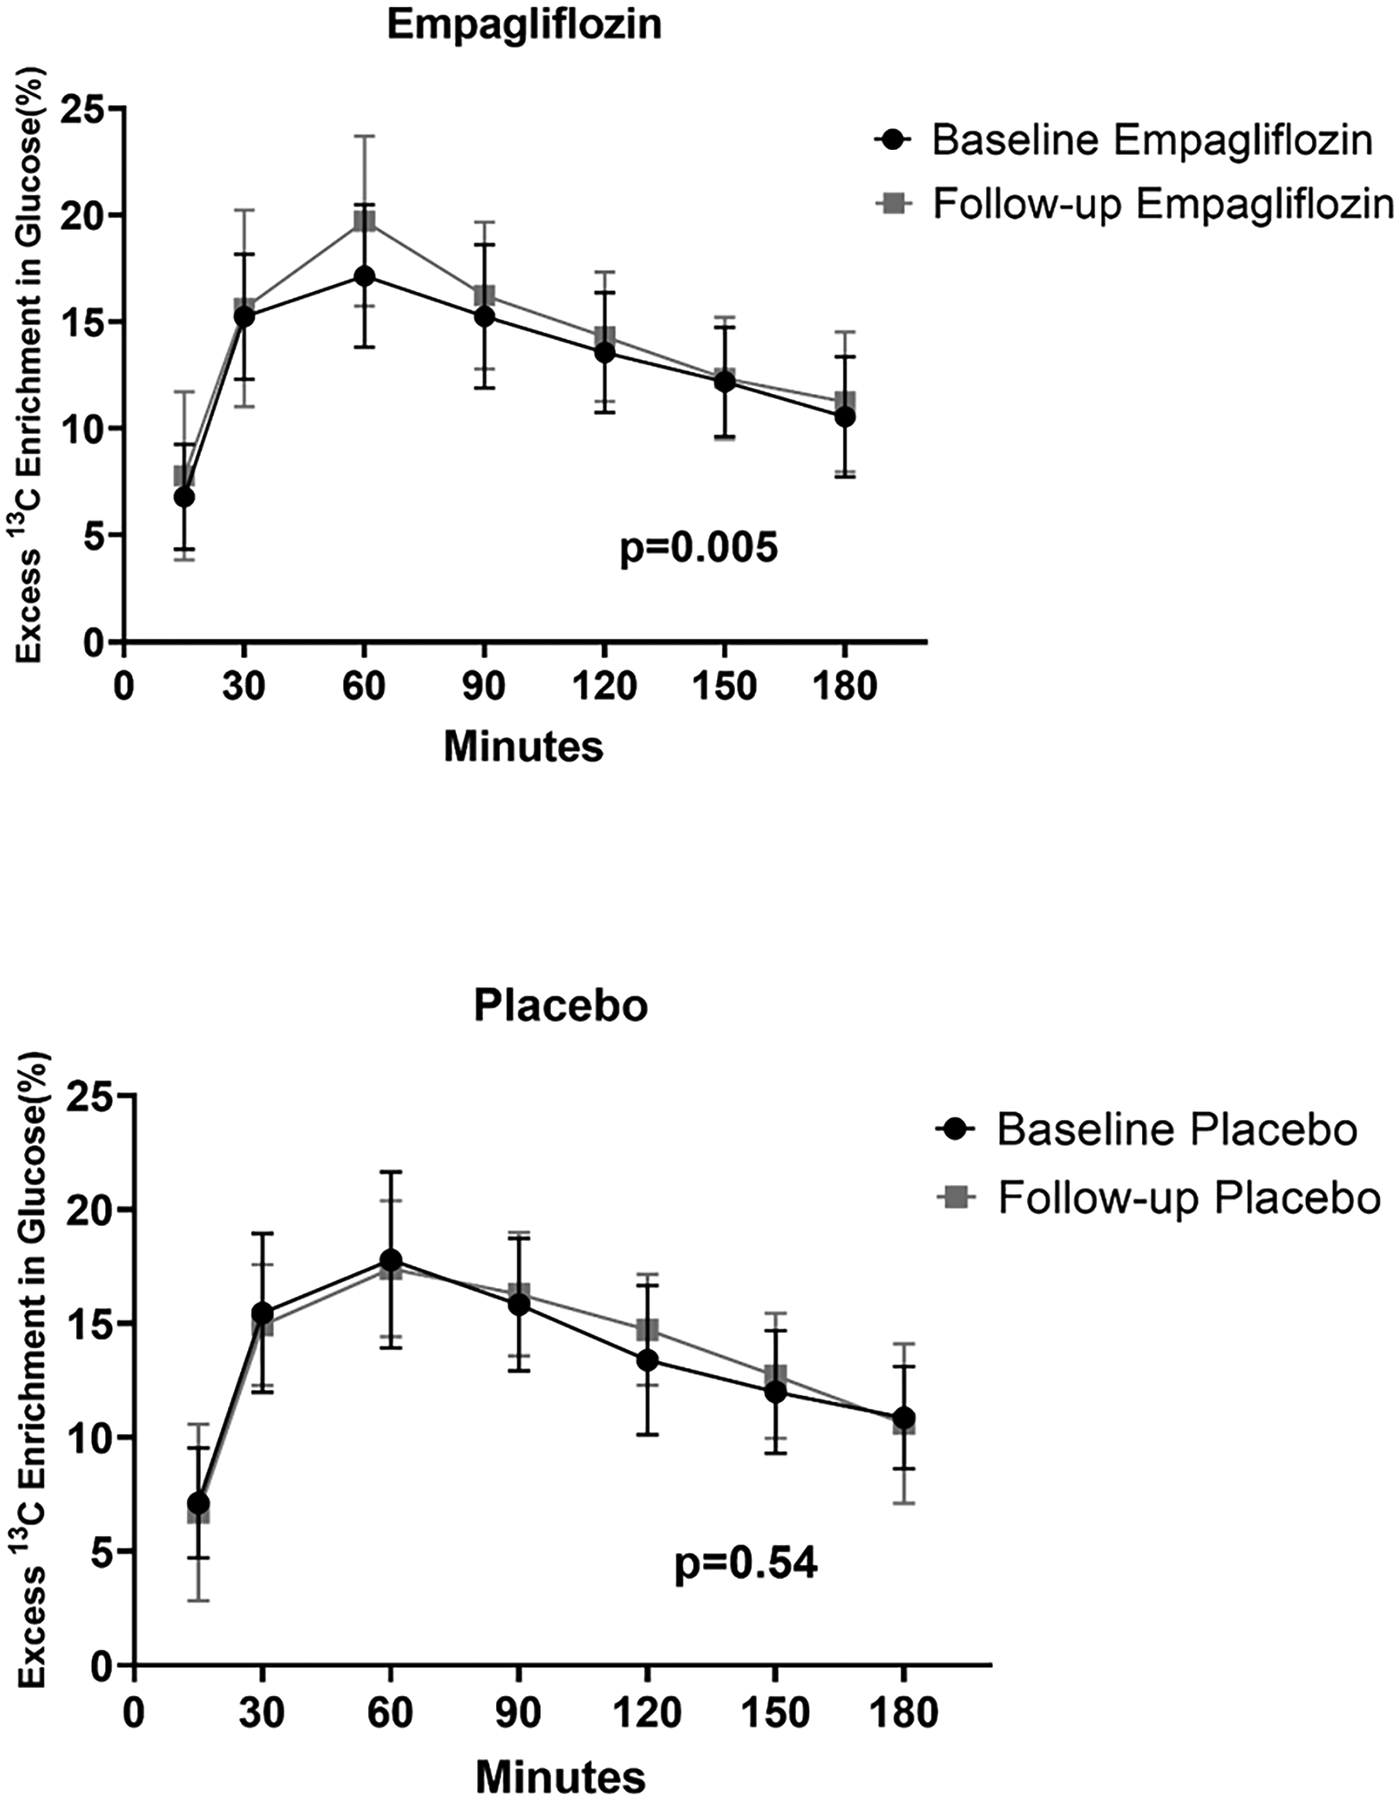
Figure 3. Effects of empagliflozin treatment on excess 13C enrichment in glucose.

Contribution of [U-13C3] glycerol to glucose production via hepatic gluconeogenesis in participants treated with empagliflozin (top panel) and matching placebo (bottom panel). There was a statistically significant 6.5% increase in the area under the curve for 13C enrichment in glucose in the empagliflozin treated group and no treatment difference with placebo. Baseline to follow-up comparisons were made using mixed linear models to account for all time points at each visit.
