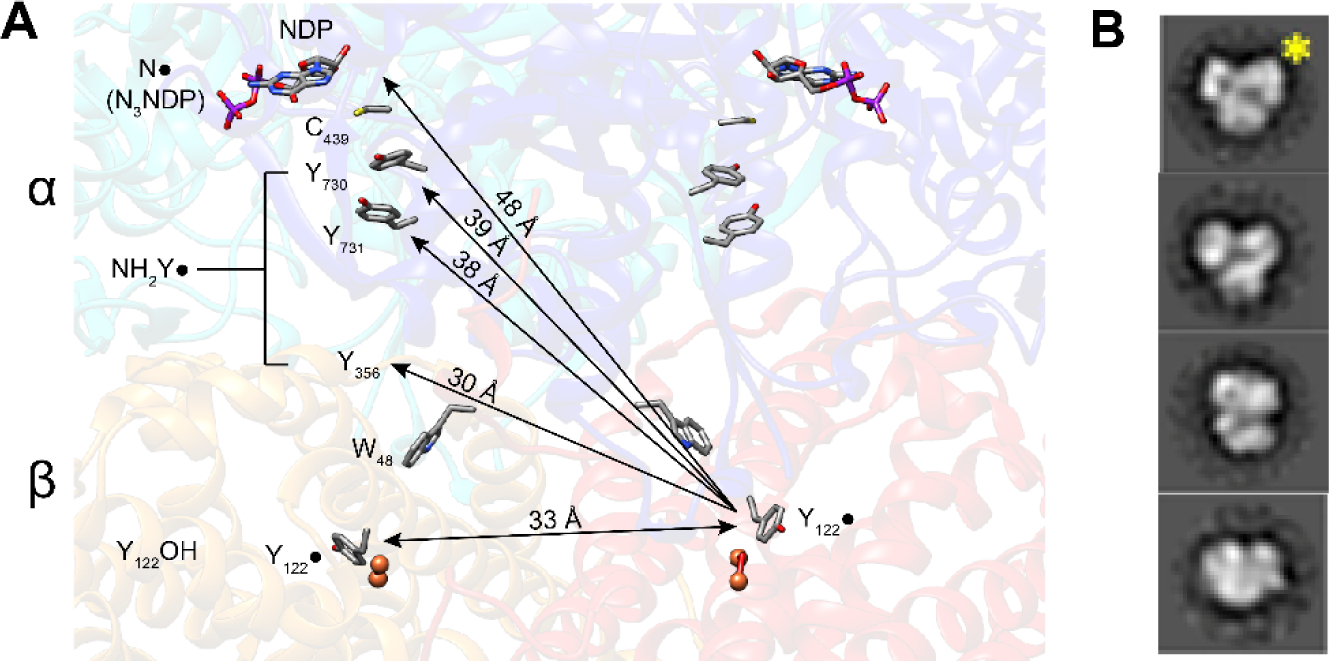
Figure 5.

Support for the Eklund docking model (Figure 2C). A PELDOR spectroscopy used to measure distances between Y122• in the unreacted α/β pair (right) and the trapped radicals (NH2Y• or N•) in the reactive α/β pair where Y122 is reduced (YOH, left). B Representative negative stain EM 2D class averages of the structures of the NH2Y730• trapped in α2β2 complex (25). The view with the yellow star resembles the Eklund docking model shown in Figure 2C.
