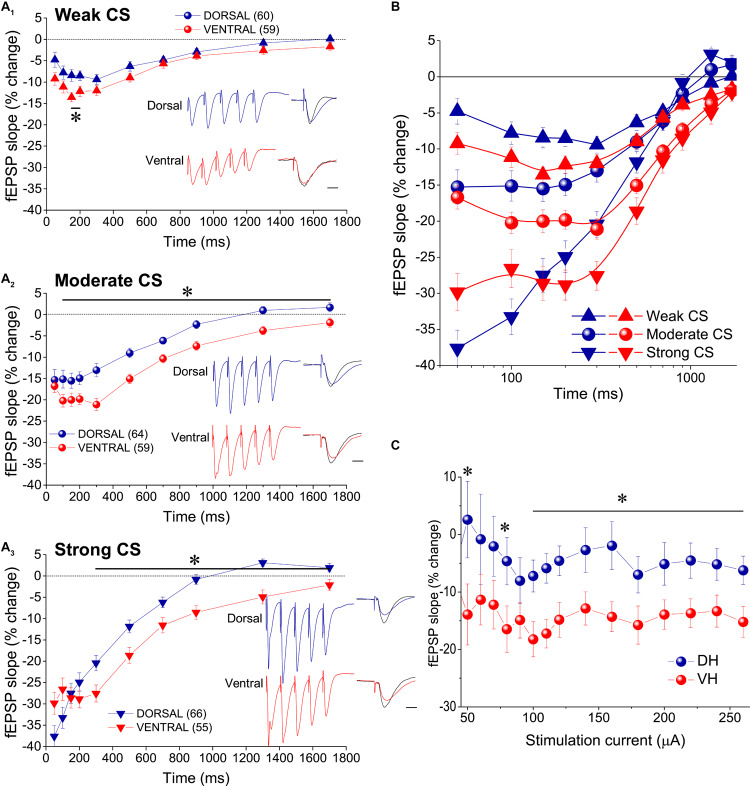
FIGURE 2.
tHSD is stronger and longer in the ventral compared with the dorsal hippocampus. (A) Diagrams presenting the time course of tHSD induced in the dorsal and the ventral hippocampus by weak (A1), moderate (A2), or strong (A3) intensity of CS. Horizontal bars with an asterisk indicate the interval of statistically significant differences in tHSD between the dorsal and the ventral hippocampus, at p < 0.05 (paired t-test). Insert graphs represent example fEPSP trace recordings; a 150 ms-long interval between conditioning and test response is omitted for clarity. Traces in black denote control responses at the conditioned path. Calibration bars: 1 mV, 10 ms. Artifacts are truncated. (B) Time courses of tHSD induced by the three intensities of CS are shown for the dorsal and the ventral hippocampus for comparison. (C) Dorsal-ventral difference in tHSD produced by a CS of moderate intensity on a test response evoked by a stimulation intensity of variable size. The inter-stimulation interval was set at 300 ms.

