
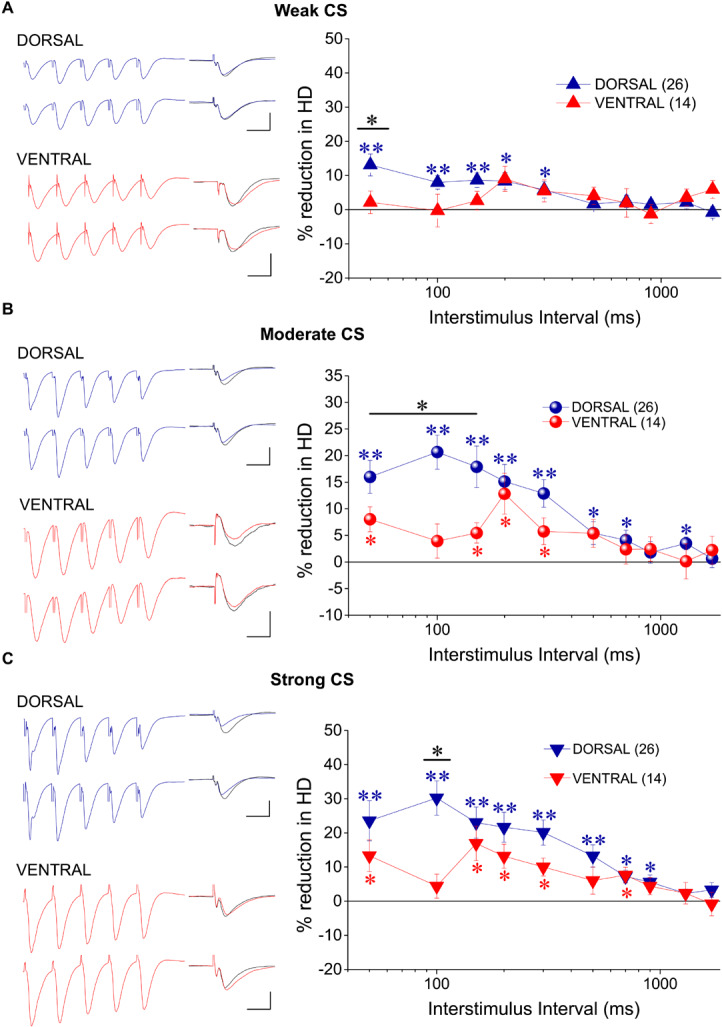
FIGURE 5.
tHSD involves activation of adenosine A1Rs more in dorsal than in ventral hippocampus. Examples of fEPSP recordings (at an inter-stimulus interval of 200 ms) and collective results are shown in the left and the right panel, respectively. The reducing effects of the antagonist of A1Rs DPCPX (150 nM) on tHSD are presented as a percent change of tHSD between normal and drug conditions. The drug effects are shown for weak (A), moderate (B), and strong intensity of CS (C). In example traces, a 150 ms-long interval between conditioning and test response is omitted for clarity reasons. Traces in black denote control responses at the conditioned path. Calibration bars: 1 mV, 10 ms. Artifacts are truncated. Numbers into parenthesis indicate the number of slices used. Asterisks above (dorsal hippocampus) or below symbols (ventral hippocampus) denote statistically significant differences between normal and drug conditions, at *p < 0.05 and **p < 0.001 (paired t-test). Horizontal bars denote statistically significant differences between the dorsal and the ventral hippocampus, at *p < 0.05 and **p < 0.001 (independent t-test). For additional statistical tests (ANOVA, MANOVA) see main text.