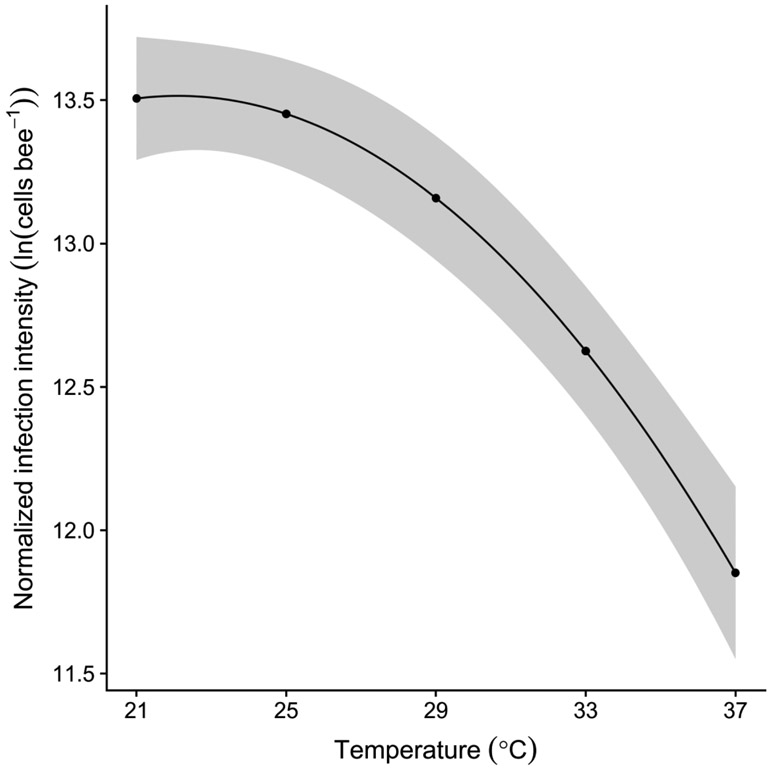
Figure 1.
Crithidia bombi infection intensity decreased with increasing temperature. Line and shaded band show fitted means and standard errors from generalized linear mixed model of normalized infection intensity after inverse log transformation from the scale of the linear predictor. Predictions are averaged over infection treatments and colonies and calculated for a bee of average gut bacterial abundance. Shaded bands indicate uncertainty from the fixed effects portion of the model only. Points show the five tested incubation temperatures.

