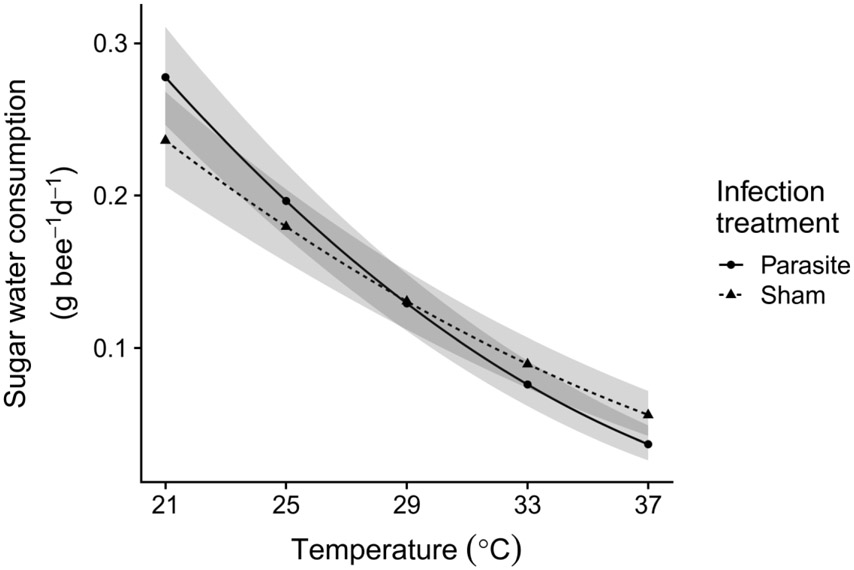
Figure 5. Sugar water consumption by bumble bees declined with temperature, with no significant effect of infection treatment.
(χ2 (1) = 0.050, P = 0.82) or the infection x temperature interaction (χ2 (1) = 3.60, P = 0.058). Lines and shaded bands show fitted means and standard errors from general linear mixed model on square root-transformed consumption, back-transformed to the original scale of the measurement. Circles and solid line: parasite infection treatment; triangles and dotted line: sham infection treatment. Predictions are averaged over colonies and calculated for a bee of average size. Shaded bands indicate uncertainty from the fixed effects portion of the model only. Points show the five tested incubation temperatures.

