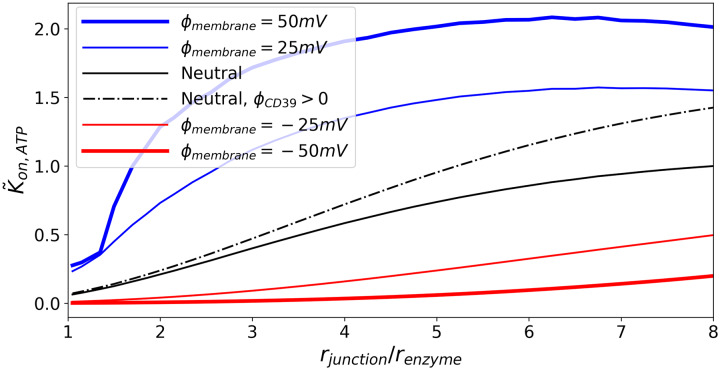
Fig 6. Effects of junction membrane electrical potential on CD39 reactivity.
kon,ATP is shown for various junction radii. Black curves represent cases where the junction membrane surface is electrically neutral. Blue curves represent cases where the junction membrane surface has an electric potential that attracts ATP. Red curves represent cases where the junction membrane surface has an electric potential that repels ATP. ΦCD39 = 0, except where noted.

