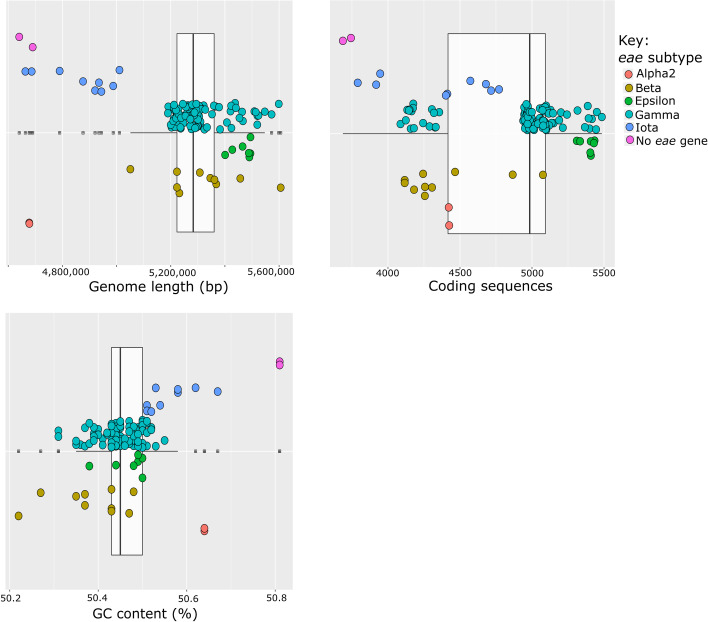
Fig 2. Box and whisker plots indicating the genome composition of E. coli serogroup O145 strains (n = 122).
The box and whisker plots indicate the genome length (bp), number of coding sequences and GC content (%) for the serogroup O145 strains (n = 122). The box spans the interquartile range, with the lower and upper quartiles indicated by the ends of the box (from left to right) and the median by the vertical line inside the box. Each data point is shown on the plots and has been grouped according eae subtype in the y axes, as indicated by the figure key.

