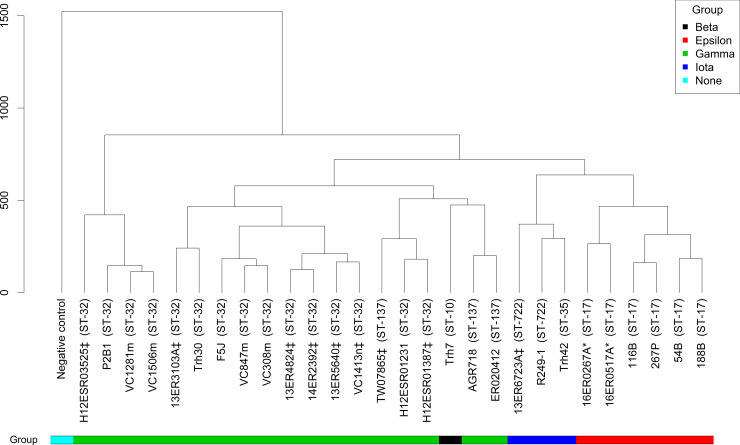
Fig 8. Cluster dendrogram showing the similarities of E. coli serogroup O145 strains based on their carbon utilisation profile using PM1 MicroPlate™.
The end-point values per serogroup O145 strain (n = 28) for each carbon substrate on the phenotypic microarray plates (n = 95) was recorded and used to produce a cluster dendrogram using hierarchical clustering, with height indicating the distance between pairs. Metadata is included for sequence type, eae subtype and whether the strains were toxigenic or non-toxigenic. Sequence type is shown in brackets, stx1 positive as * and stx2 positive as ‡.

