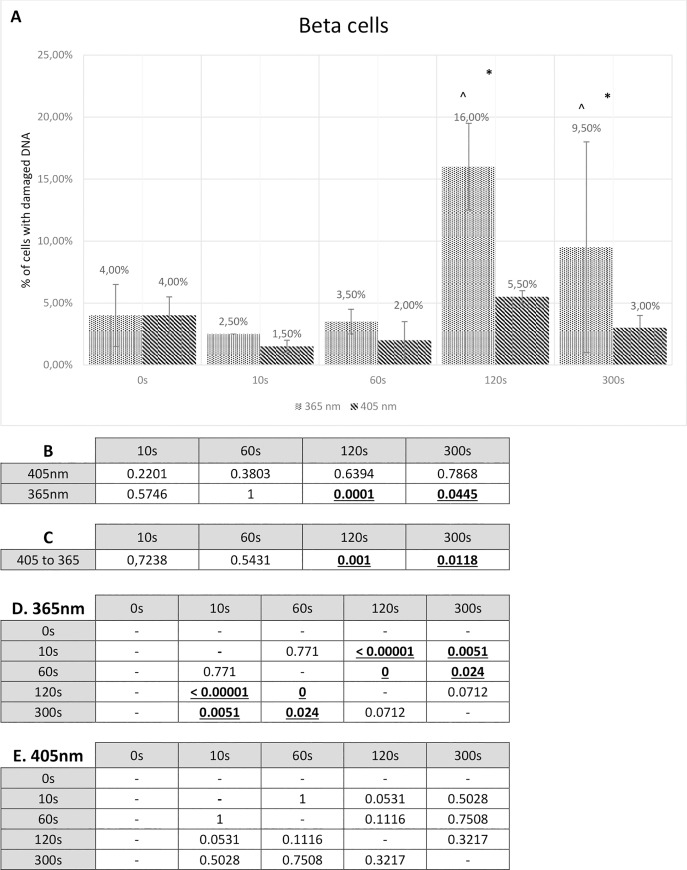
Fig 6. Comet assay results for beta cells.
A Comet assay results presenting the percentage of beta cells with any degree of DNA damage. The Fisher exact test statistic value comparing 405 nm to 365 nm: * - p < 0.05; ** - p < 0.0001. The Fisher’s exact test statistic value comparing radiation (405 nm and 365 nm) to control: ^ - p < 0.05. Standard deviation bars are present for every value. B P-value calculated by means of the Fisher’s exact test. P-value of beta cells used in the comet assay study compared to control. C P-value calculated by means of the Fisher’s exact test. P-value of beta cells treated with 405 nm radiation compared to 365 nm radiation. Statistically relevant p-values, where p < 0.05, are shown underlined and in bold font. D P-value calculated by means of the Fisher’s exact test. P-values comparing different 365 nm radiation time periods. E P-value calculated by means of the Fisher’s exact test. P-values comparing different 405 nm radiation time periods.

