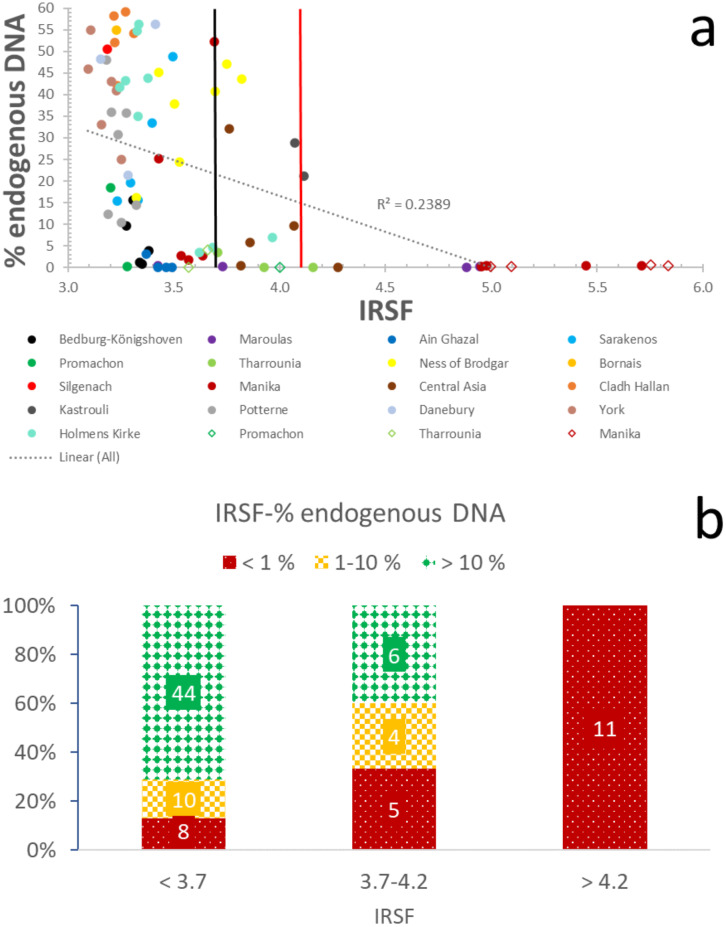
Fig 1. Endogenous DNA-crystallinity relationship.
(a) Correlation of IRSF with endogenous DNA yields. The black line at 3.7 IRSF represents the proposed ‘strict’ threshold, while the red line at 4.2 IRSF represents the ‘moderate’ threshold. The circles represent the petrous bones, and the rhombuses the other skeletal elements. (b) Distribution of samples with well- (> 10%; green/solid diamond), moderately- (1–10%; yellow/large checkerboard), and poorly-preserved (< 1%; red/dotted) endogenous DNA in categories based on crystallinity.

