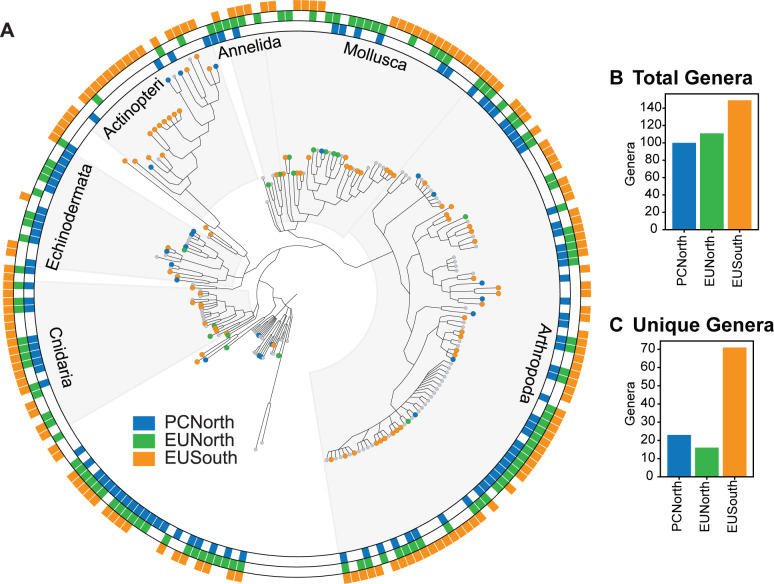
Fig 6. Detection of genera across regions.
Detection of genus-level annotations within the COI Banzai dataset across the three regions: PCNorth (blue), EUNorth (green), and EUSouth (yellow). (A) Cladogram of genera detected. A colored bar within the ring indicates presence of OTUs annotated to that genus within the dataset. A blue, green, or yellow circle at the leaf of the tree indicates that genus was found only within that region. Highly abundant phyla are labeled. (B) Bar plot showing number of total genera found within each region. (C) Bar plot showing number of unique genera found within each region.

