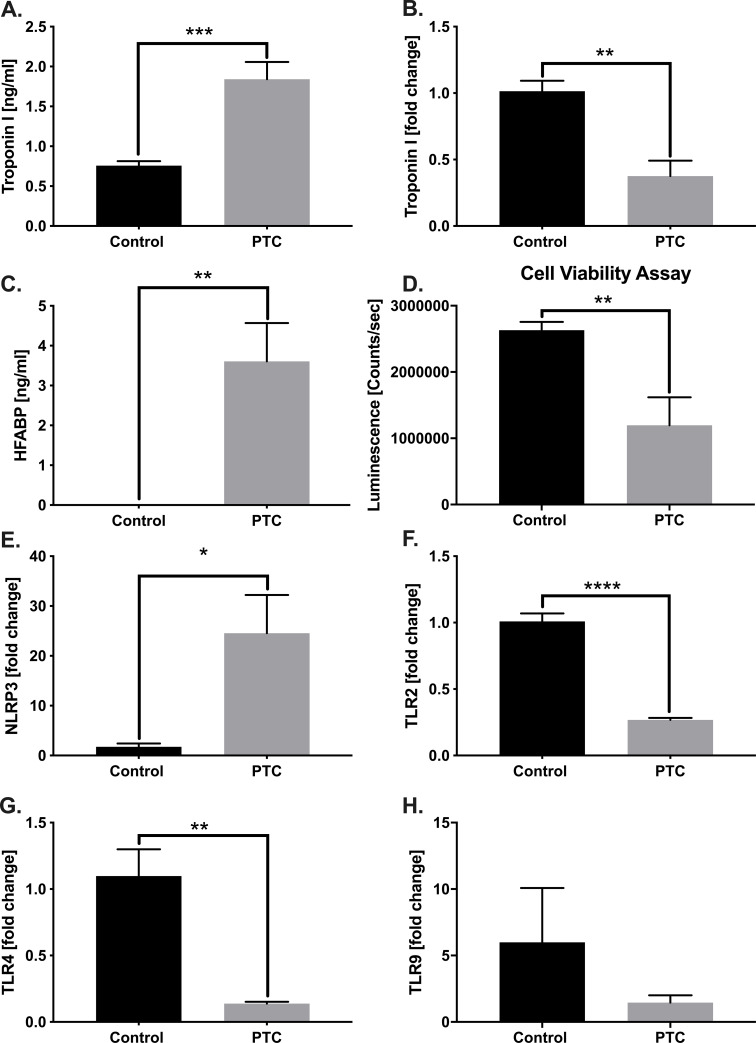
Fig 6. In vitro analysis of HL-1 cells treated with polytrauma cocktail (PTC).
A) Troponin I level in supernatant of HL-1 cells in presence of PTC presented as ng/ml. B) mRNA expression of troponin I presented as fold change. C) Amount of heart fatty acid binding protein (HFABP) in supernatant of HL-1 cells after incubation with PTC presented as ng/ml. D) Cell viability in counts/sec in presence of PTC compared to control (PBS). E) mRNA expression of NLRP3 detected by RT-qPCR presented as fold change. mRNA expression of TLR-2 (F), -4 (G) and -9 (H) in presence of PTC presented as fold change. Results are significant (*) p<0.05. Graphical presentation as mean ± SEM. For statistical analysis students t-test was used. For all experiments n = 6.

