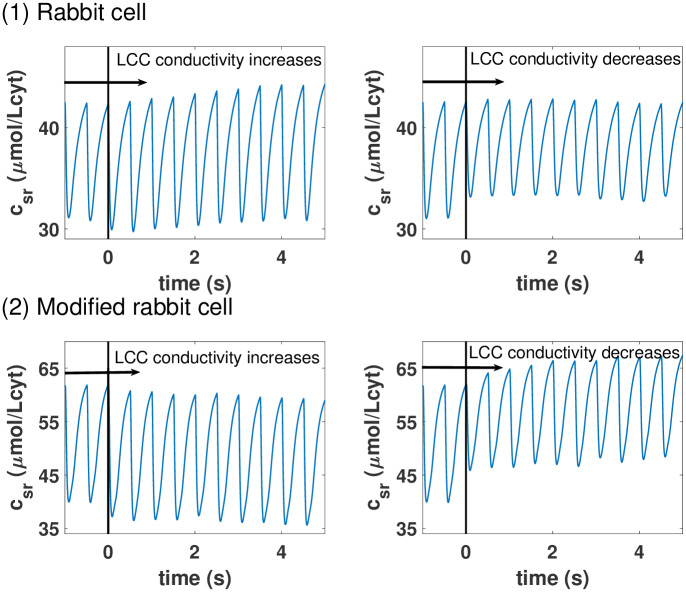
Fig 2. Example of counterintuitive calcium homeostatic regulations.
Panel (1): Evolution of the SR free calcium concentration when, at a time marked by a black vertical line, the conductivity of the LCC is increased (left) or decreased (right). An increase in intake via the LCC leads to a cardiomyocyte with higher calcium average concentrations in the SR. Panel (2): Response of the cardiomyocyte to an increase in LCC conductivity, as in the first panel, when its buffering and SERCA uptake is different. Now, the increased intake via LCC is homeostatically regulated in a completely different way. The higher level of calcium intake leads to an even larger extrusion for the SR leading to a lower calcium load.

