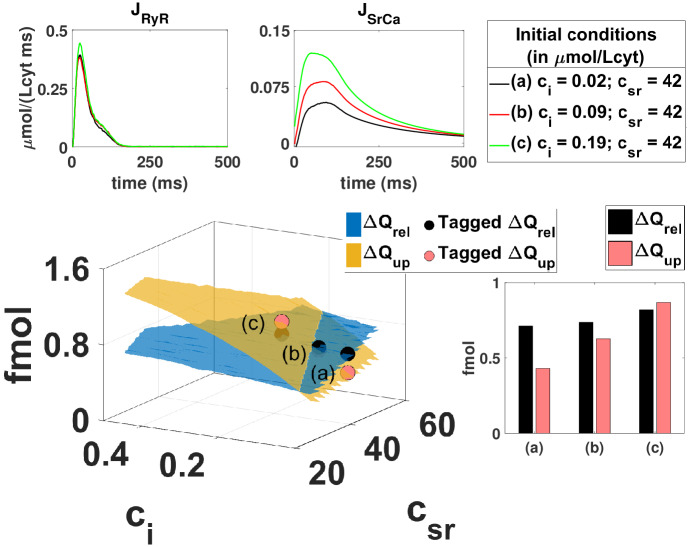
Fig 3. Schematics of the procedure to reconstruct one of the nullclines of the system.
The nullcline corresponds to the partial equilibrium where the intake of calcium into the SR equals its release, where we have multiplied all ΔQ by the volume of the cytosol, to obtain this value in femtomols (fmol). The main central graph reproduces total release ΔQrel and uptake ΔQup as a function of the initial free concentrations in the cytosol ci(t = 0) and SR cSR(t = 0). The nullcline is determined by the line where both surfaces cross. For each initial condition, one single transient is simulated and the release JRyR and uptake JSrCa computed and shown in the upper graphs. The integrated values are indicated in the bar graph below and then placed as elements of the surface. The whole surface is constructed by reproducing this procedure with multiple different initial calcium concentrations where all other initial variables are in their fast equilibrium approximation.

