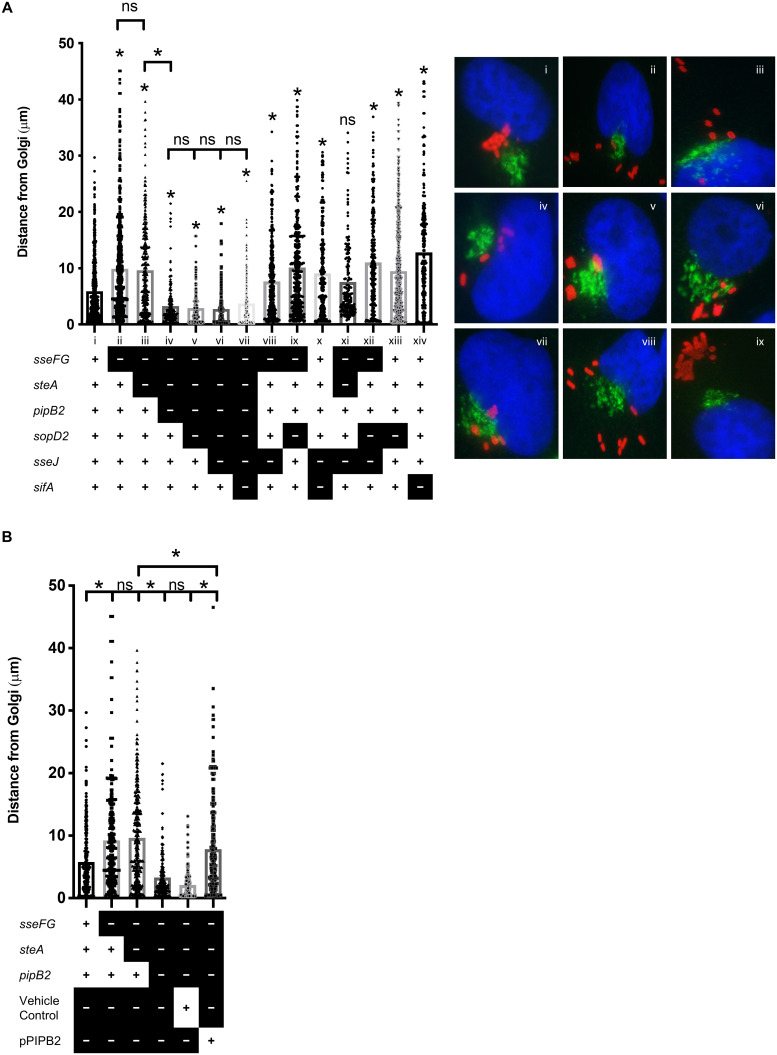
Fig 3. Multiple effectors drive SCV movement away from the Golgi complex.
HeLa cells were infected with the indicated S.
Typhimurium strains for 8 hours, fixed, and immunostained for
Salmonella (red) and Golgin-97 (green), and the
nucleus was stained with DAPI (blue). (A) Quantification of
S. Typhimurium position relative to the Golgi. The
distances from the center of individual bacteria to the nearest edge of
the Golgi complex was measured in infected cells. Strain legend: “+” =
gene present, “-” = gene deleted. All data points are shown to
accurately indicate the spread of the data. The averages for three
separate experiments are shown (n = 3). An asterisk
indicates a significant difference (p < 0.003)
between the indicated mutant strain and the corresponding WT strain or
other strain if indicated by  as determined by a Kruskal-Wallis one-way ANOVA
with Dunn’s multiple comparison post-test. ns = not significant.
(B) Select representative images used to enumerate
distances in (A). (C) SL1344 strain
ΔsseFGΔsteAΔpipB2
was complemented with a low-copy plasmid expressing a functional copy of
PipB2. HeLa cells were infected, fixed, stained, and analyzed as
described in (A).

