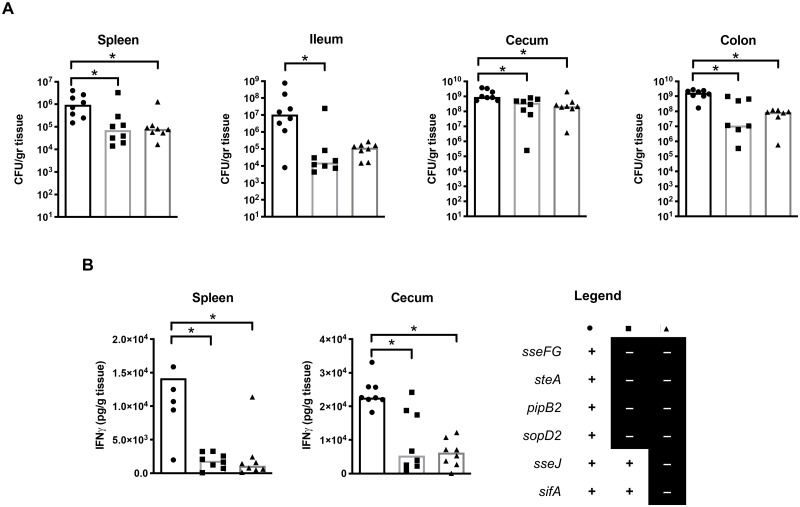
Fig 5. Gastroenteritis model of S. Typhimurium infection.
Mice were treated with streptomycin for two days prior to oral infection with select S. Typhimurium strains to induce gastroenteritis as per Sekirov et al., 2008. Strain legend found on bottom right of figure: “+” = gene present, “-” = gene deleted. A “+” for all genes indicates wild type. A single asterisk indicates a significant difference between the indicated strains (p < 0.03) as determined by a Kruskal-Wallis one-way ANOVA with Dunn’s multiple comparison post-test. (A) Bacterial counts were recovered from systemic and intestinal organs of mice three days post-infection. Counts given represent colony forming units per gram of tissue. The median CFU/g for three separate experiments is shown with individual data points visible to accurately represent the spread of the data. (B) IFNγ-levels as determined by ELISA. The median amount of IFNγ (pg of IFNγ/g of tissue) is shown with individual data points visible to accurately represent the spread of the data.

