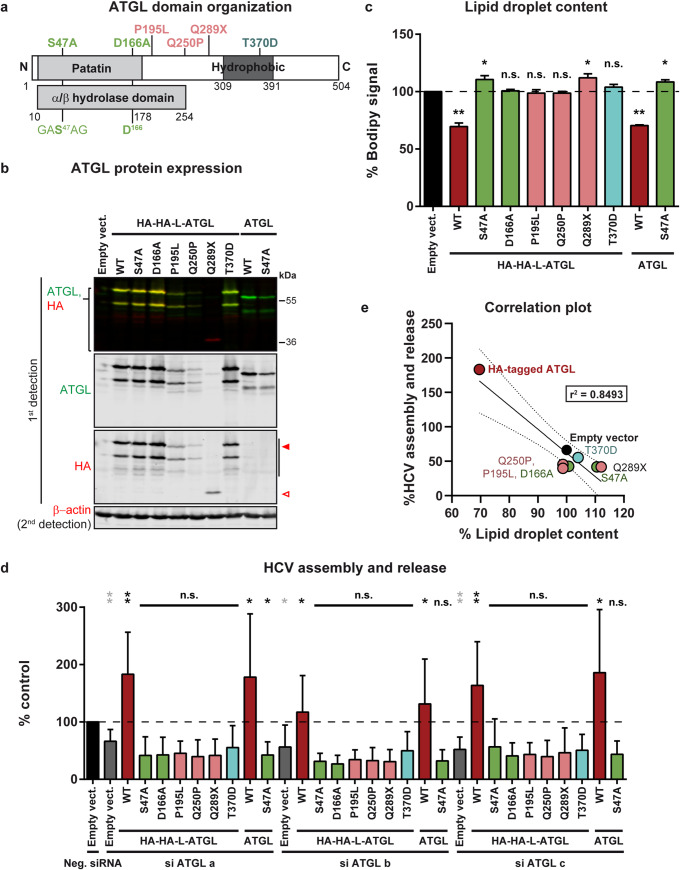
Fig 7. Pathogenic variants of ATGL do not support HCV assembly nor lipid droplet lipolysis.
(a) Domain organization of human ATGL and description of the mutants used in this study. The patatin domain is conserved in a large family of hydrolases found in eukaryotes and bacteria [32] and is included in an α/β hydrolase domain. It comprises the two putative residues of the catalytic diad (S47 in the conserved GXSXG sequence and D166). Coding polymorphisms associated with NLSDM [35] and tested in this study are indicated in pink. Q289X corresponds to a premature stop codon. The T370D mutation is a phosphomimetics described to eliminate lipid droplet association of the mouse ATGL (T372D) without compromising the hydrolase activity [43]. (b) Western blot verification of the protein expression of the various ATGL variants in Lunet N hCD81 Fluc cells 7 days post-lentiviral transduction, at the time when HCV replication and production were measured. The full red arrowhead indicates the full-length HA-tagged ATGL whereas the empty red arrowhead points at the Q289X truncation mutant. Note that the upper band (around 56 kDa for the untagged ATGL) corresponds to the reported molecular weight of ATGL [44]. The second lower band could be a cleavage product of ATGL corresponding to the N-terminal part of the protein, since it is detected by the anti-HA antibody. We also observed this second band when staining the endogenous protein (see empty vector as well as Fig 4B, band just over the β-actin (42 kDa)). Although this band was to our knowledge not described from the literature, a fragment of around the same size could be seen in [45] (see Fig 1C for instance) as well as in the datasheets of several commercial anti-ATGL antibodies. (c) Cellular lipid droplet content in Lunet N hCD81 cells upon ectopic expression of untagged or HA-tagged ATGL variants, as measured by BODIPY 493/503 staining and flow cytometry (n = 3). (d) HCV assembly and release in Lunet N hCD81 Fluc cells upon ATGL knockdown with si ATGL a, b or c and rescue of ATGL expression with siRNA-resistant tagged or untagged ATGL variants. The horizontal dotted line corresponds to the control (neg. siRNA and empty vector). Statistics in grey highlight the knockdown effects and test differences between the different knockdowns (si ATGL a/b/c + empty vector, in grey) and the control (black bar). Statistics in black correspond to the rescue experiment and show differences to the respective grey bar (respective siRNA + empty vector) (n = 8). (e) Correlation between HCV production and lipid droplet lipolysis. This graph gathers the results plotted in panels c and d as well as the linear regression (full line), 95% confidence band (dotted lines) and r2 value. Note that the lipid droplet content is tested in an over-expression assay (X axis), whereas HCV assembly and release are assessed in the context of the rescue of an ATGL knockdown (Y axis). This is why the empty vector is set at 100% on the X axis, but at a lower value for the Y axis (presence of ATGL siRNA). (c, d, e) WT ATGL sequences (tagged or untagged) are indicated in dark red, the catalytic site mutants are in green, the clinical variants in pink and the phosphomimetics T370D mutant in light blue.

