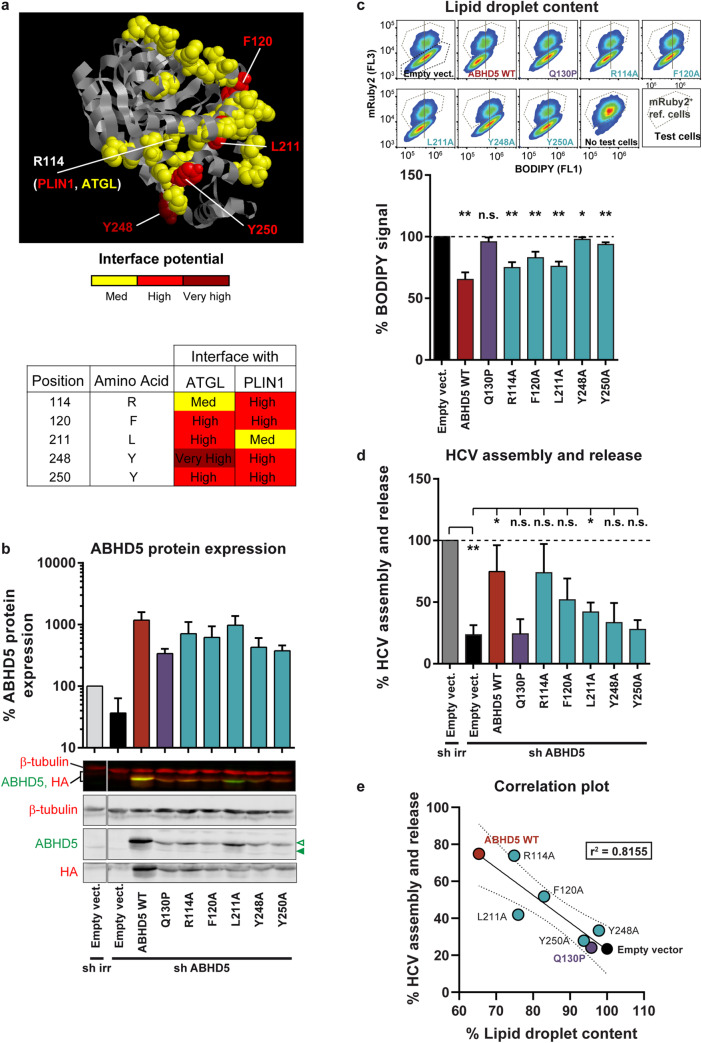
Fig 9. ABHD5 mutants of the predicted ATGL interface have impaired co-lipase and pro-viral functions.
(a) ABHD5 interaction to ATGL was predicted using Interactome INSIDER (http://interactomeinsider.yulab.org/, [46]) and the involved residues were depicted on the ABHD5 3D model (ModBase B2R9K0, ribbon representation with key residues as space-filling spheres). We mutated those residues that belong with a high or very high confidence to the ATGL and/or PLIN1 interface. Note that the two predicted interfaces overlap, but R114 has a higher interface potential with PLIN1 while L211 is more likely to interact with ATGL. (b) Verification by Western blot of ABHD5 protein expression upon knockdown and complementation in Lunet N hCD81 FLuc cells, 4 days post lentiviral transduction (at the time when HCV replication and production were assessed). Protein expression was quantified with the Odyssey imager and normalized to β-tubulin and to ABHD5 endogenous expression level (n = 3). Green arrowheads indicate the HA-tagged (empty arrowhead) and endogenous (full arrowhead) ABHD5 proteins. (c) Cellular lipid droplet content in Lunet N hCD81 cells upon expression of the different ABHD5 mutants. Representative flow cytometry plots are shown at the top and the average effects are plotted at the bottom (n = 5). (d) HCV assembly and release in Lunet N hCD81 FLuc cells upon ABHD5 knockdown and complementation with shRNA-resistant ABHD5 mutants of the predicted ATGL/PLIN1 interface (n = 3). (e) Correlation between HCV production and lipid droplet lipolysis. This graph gathers the results plotted in panels c and d as well as the linear regression (full line), 95% confidence band (dotted lines) and r2 value. Note that the lipid droplet content is tested in an over-expression assay (X axis), whereas HCV assembly and release are assessed in the context of the rescue of an ABHD5 knockdown (Y axis). This is why the empty vector is set to 100% on the X axis, but to a lower value for the Y axis (presence of ABHD5 shRNA).

