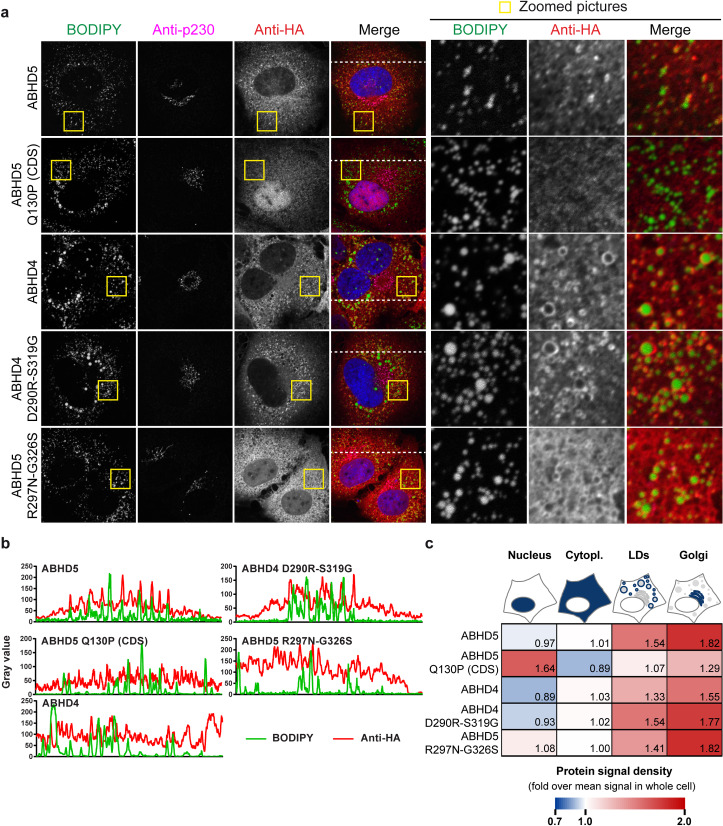
Fig 12. Subcellular localization of the ABHD4/5 mutants.
(a) Immunofluorescence analysis of HA-tagged ABHD4/5 localization respectively to the lipid droplets (BODIPY 493/503) and trans-Golgi (p230 marker) in transduced Lunet N hCD81 cells. (b) Intensity profiles of the green and red channels along the line depicted in the merge pictures of panel a. (c) Quantification of ABHD4/5 accumulation in the nucleus, the cytoplasm, the Golgi apparatus and at the lipid droplet periphery. The heatmap shows the fold enrichment of the protein signal in each compartment as compared to the mean protein signal in the whole cell. The average of 3 experiments with at least 10 pictures per experiment is depicted.

