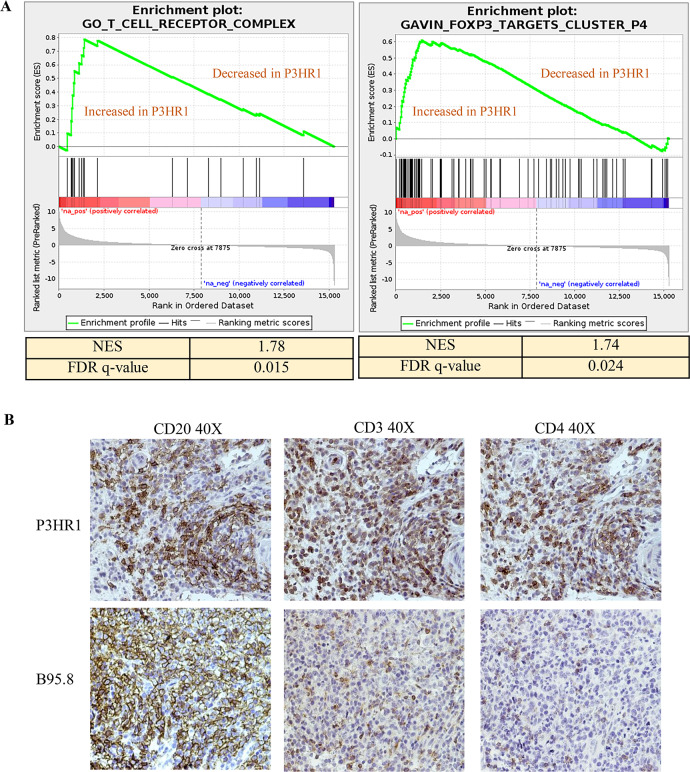
Fig 11. P3HR1 virus infected tumors are heavily infiltrated with CD4 positive T cells and show a T reg signature.
A. Gene set enrichment analysis (GSEA) plot for the (“Go_T_cell receptor _complex”) and the “Gavin_foxp3-targets cluster _P4” gene set are shown in P3HR1 virus-induced lymphomas compared to B95.8 virus-infected lymphomas. B. IHC analysis using antibodies against CD20, CD3 or CD4 is shown in tumors infected with P3HR1 (mouse # 1 in S1 Table) or B95.8 viruses as indicated.

