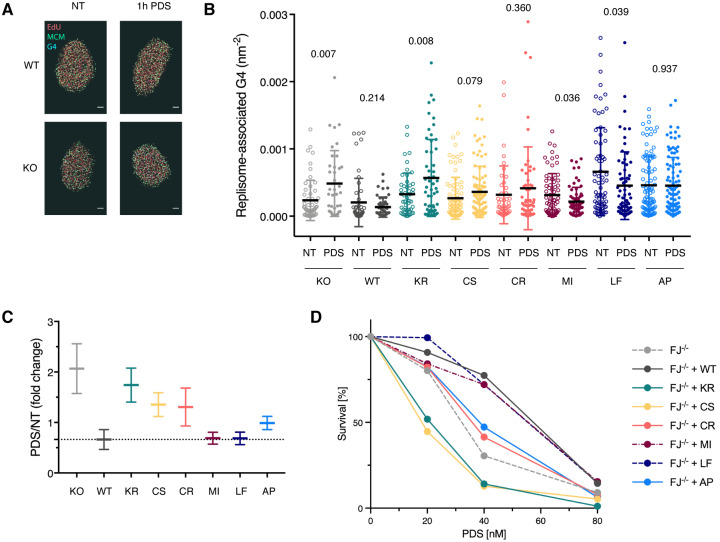
Fig 4. The FeS cluster is required to efficiently prevent replisome-associated G4 structures.
(A) Representative SMLM images labelled for nascent DNA (red), G4 structures (blue), and MCM (green) to detect replisome-associated G4 structures. Scale bar, 2 μm. (B) Densities of replisome-associated G4 structures in FANCJ knock-out cells (KO) complemented with the indicated variants. Each cell line was either non-treated (NT) or treated for 1h with 20 μM PDS. Individual data point represents result from one nucleus. Black horizontal line and error bars indicate mean ± standard deviation. Values on graph indicate p-values of unpaired two-sample t-tests between NT and PDS-treated cells. Note that for technical reasons not all cell lines were treated in parallel, and, hence, absolute values between cell lines were not compared. For raw values and analysis see S2 Table. (C) Averaged fold change of the densities of replisome-associated G4 structures in PDS-treated compared to non-treated cells. Bold horizontal lines represent the ratio between the mean values of PDS-treated and NT cells from (B), and the error bars indicate the propagated standard errors of the mean. (D) Sensitivity of FANCJ HeLa FIT knock-out cells (FJ–/–) complemented with different FANCJ constructs to PDS treatment. In the graph, the mean values of three independent experiments are depicted. For raw values, standard deviations and statistical analysis see S3 Table. WT, wild-type; KR, K52R; CS, C283S; CR, C283R; MI, M299I; LF, L340F; AP, A349P.

