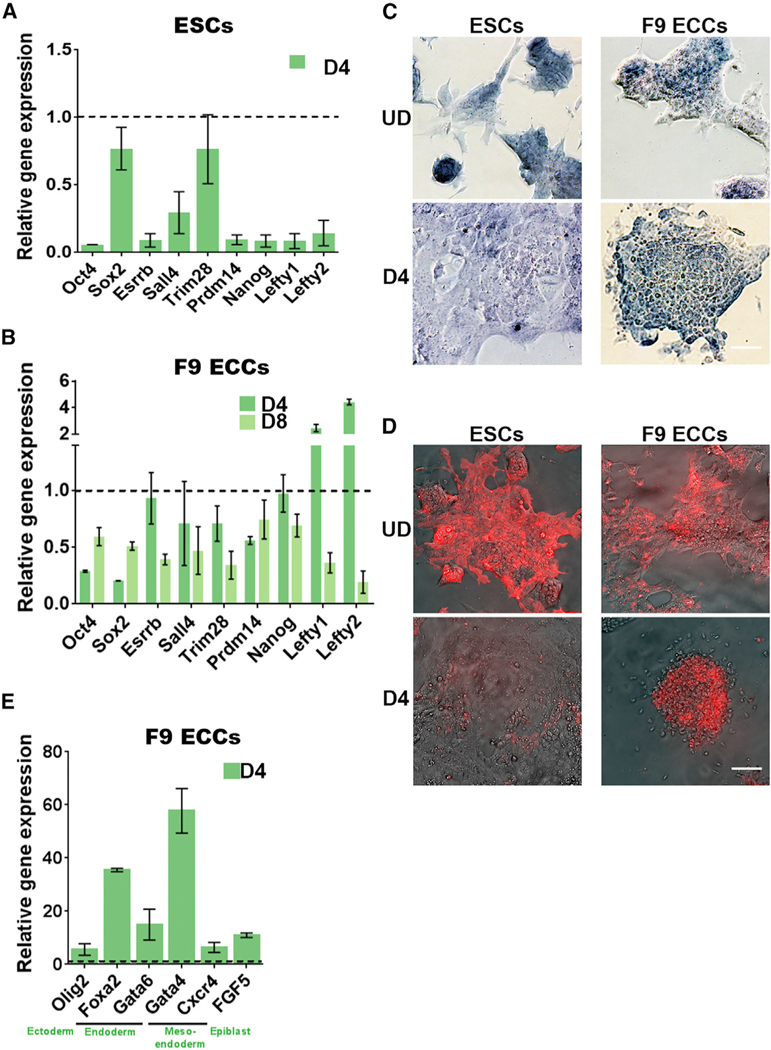
Figure 1. Pluripotency Genes Are Partially Repressed in Embryonal Carcinoma Cells.

(A, B, and E) Gene expression analysis by qRT- PCR of PpGs in (A) F9 ESCs, (B) ECCs, and (E) lineage-specific genes in F9 ECCs. The threshold cycle (Ct) values for each gene were normalized to Gapdh, and expression is shown relative to that in undifferentiated cells (dotted line). In F9 ECCs, the lineage-specific genes show a 5- to 60-fold induction of gene expression (E), whereas the expression of PpGs is, on average, reduced to about 50% post-differentiation (B). Average and SEM of two biological replicates are shown for each gene.
(C and D) Alkaline phosphatase staining (C) and SSEA-1 immunofluorescence (D) of ESCs and F9 ECCs pre- and post-differentiation. A positive signal indicates pluripotency that is lost post-differentiation in ESCs. Scale bars, 100 μm.
UD, undifferentiated; D4 and D8, days post-induction of differentiation; ESCs, embryonic stem cells; F9 ECCs, F9 embryonal carcinoma cells; PpGs, pluripotency genes.
