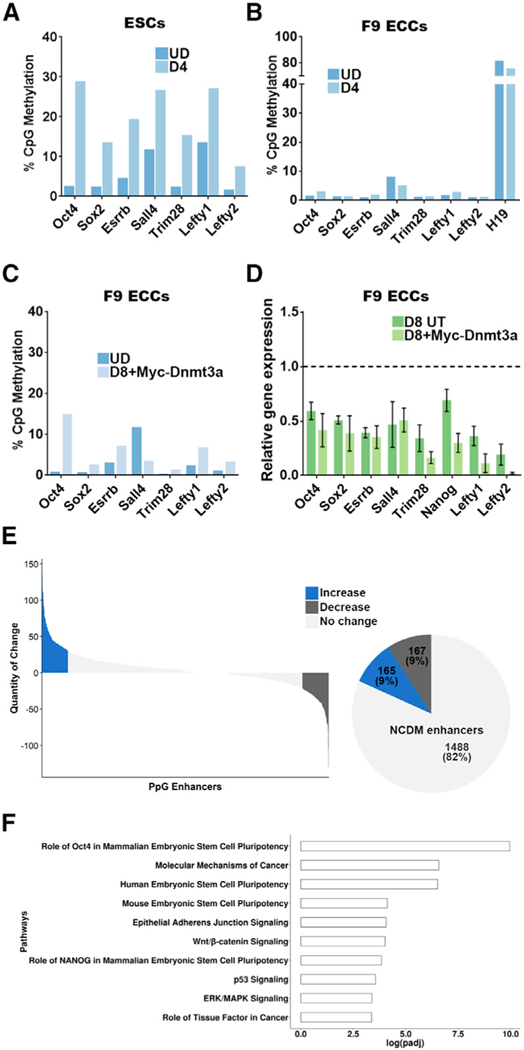
Figure 2. Pluripotency Gene Enhancers Do Not Gain DNA Methylation in Embryonal Carcinoma Cells.

(A-C) DNA methylation analysis using Bis-seq. Genomic DNA was treated with bisulfite and PpGe regions were amplified by PCR. The amplicons were sequenced on a high-throughput sequencing platform (Wide-Seq), and the data were analyzed using Bismark software. DNA methylation of PpGe in (A) ESCs and (B) F9 ECCs pre- and post-differentiation. Less than 10% DNA methylation was recorded in F9 ECCs, where as the H19imprinted region, used as a control, showed DNA methylation at 80%. At the same regions, DNA methylation increased up to 30% in ESCs. See also Figure S1A. (C) DNA methylation of PpGe in F9 ECCs overexpressing Myc-Dnmt3a.
(D) Gene expression analysis by qRT-PCR PpGs in F9 ECCs overexpressing Myc-Dnmt3a pre- and post-differentiation. (C) shows low levels (less than 10%) in DNA methylation at most PpGe, and (D) shows no significant decrease in expression in 5 out of 8 tested PpGs (p > 0.1). The Ct values for each gene were normalized to Gapdh, and expression is shown relative to that in undifferentiated cells (dotted line). (E) Genome-wide DNA methylation analysis by MethylRAD sequencing. Genomic DNA was digested with the restriction enzyme FspEI, which cuts methylated DNA into 31–32 bp fragments. The fragments were sequenced and mapped on an mm10 mouse genome. The number of reads per region were used as a measure for the extent of DNA methylation and compared between undifferentiated and D4 differentiated F9 ECCs. The waterfall plot shows DNA methylation changes at PpGe, which were computed by subtracting normalized counts in D4 samples from normalized counts in undifferentiated samples. Upper and lower quartiles were used in thresholding regions as gaining or losing methylation. The pie chart shows fractions of PpGe with increase, decrease, or no change in DNA methylation (NCDM). See also Figure S2B.
(F) Top ten statistically significant enriched canonical pathways among the genes associated with the NCDM enhancers, which showed no change. The x axis shows the log10 (adjusted p value), with the p value adjusted for multiple testing using the Benjamini-Hochberg method.
Data for (A)-(D) are the average and SEM of two biological replicates. UD, undifferentiated; D4 and D8, days post-induction of differentiation; D8 UT, untransfected F9 ECCs differentiated for 8 days; D8+Myc-Dnmt3a, F9 ECCs overexpressing Myc-Dnmt3a and differentiated for 8 days; ESCs, embryonic stem cells; F9 ECCs, F9 embryonal carcinoma cells; PpGe, pluripotency gene enhancers.
