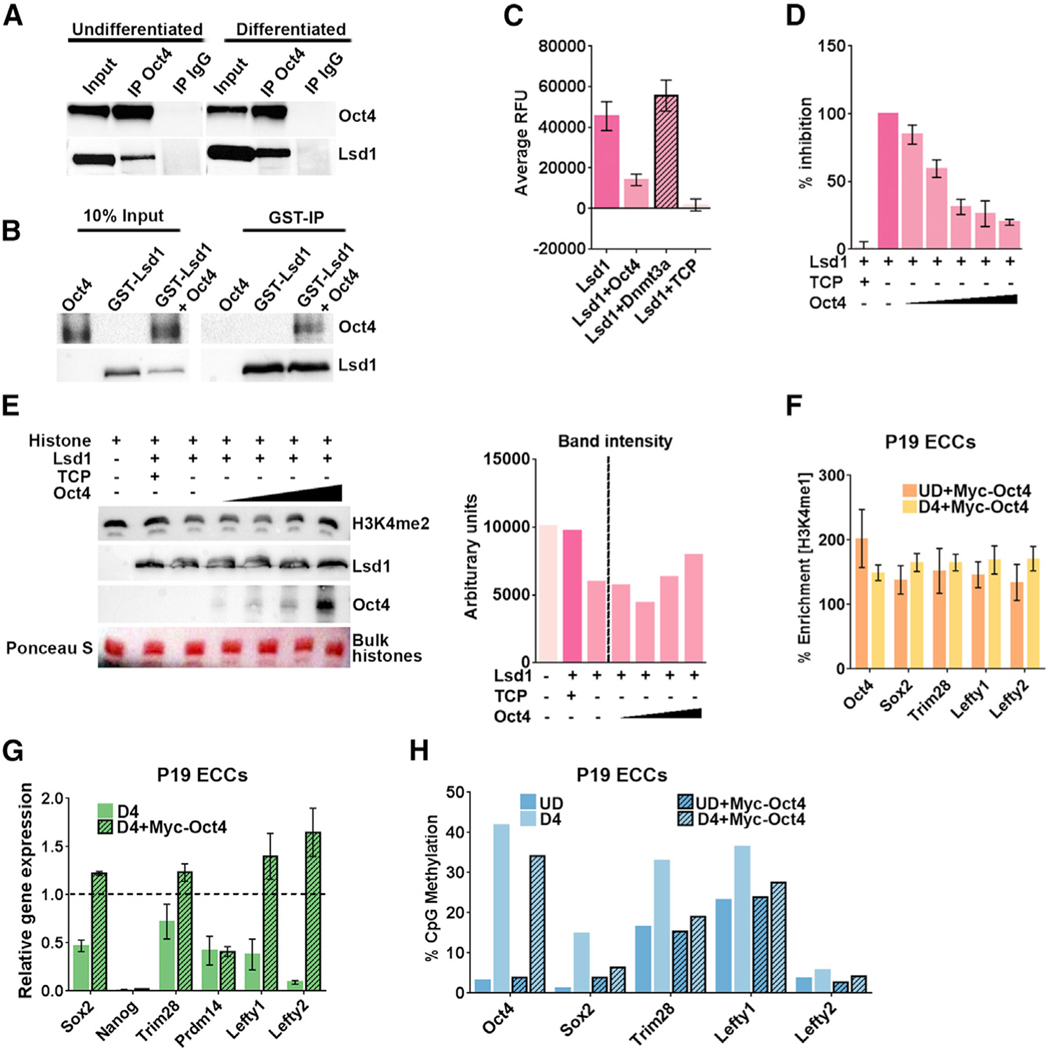
Figure 6. Oct4 Interacts with Lsd1 and Inhibits Its Catalytic Activity.

(A) Nuclear extract from undifferentiated and D4 differentiated F9 ECCs was used to perform coIP with anti-Oct4 antibody and control immunoglobulin G (IgG). 10% ofthe input and eluate from coIP were probed for Oct4 and Lsd1 on western blot. The vertical space denotes the extra lane in the gel that was digitally removed.
(B) Glutathione S-transferase (GST) pull-down experiment showing direct interaction between Lsd1 and Oct4. Recombinant GST-Lsd1 was incubated with Oct4 at about a 1:2 molar ratio and precipitated using GST-Sepharose. The co-precipitated Oct4 is detected using anti-Oct4 antibody. The vertical space denotes the extra lane in the gel that was digitally removed.
(C) Lsd1 demethylase assay was performed using 0.25 μM Lsd1 and H3K4me2 peptide as substrate. Lsd1 demethylation activity was completely inhibited by 0.1 mM TCP (tranylcypromine) in the reaction. To test the effect of Oct4 on Lsd1 activity, demethylation assays were performed in the presence of 0.5 μM Oct4 ata1:2 (Lsd1:Oct4) molar ratio. The catalytic domain of Dnmt3a at the same molar ratio was used as a control.
(D) Dose-dependent inhibition assays were performed using increasing concentrations of Oct4 in the following molar ratios of Lsd1:Oct4: (1:0.5), (1:1), (1:2), (1:3), (1:4). Data are an average and SD of at least 5 experimental replicates.
(E) Lsd1 demethylation assays were performed using 0.25 μM Lsd1 and 30 mg bulk histones as substrate with increasing concentrations of Oct4 in the reaction. Upper panel: histone demethylation was detected by using anti-H3K4me2 on a western blot,which shows retention of signal with increasing concentrations of Oct4. Lower panels: amount of Lsd1 enzyme and increasing amounts of Oct4 in the histone demethylation reaction. Ponceau S stain of bulk histones shows equal loading on the gel. The bar graph on the right shows quantification of H3K4me2 signal using ImageJ software.
(F) ChIP-qPCR showing percent enrichment of H3K4me1 at PpGe in P19 ECCs stably expressing recombinant Myc-Oct4 pre- and post-differentiation. The data show retention of H3K4me1 post-differentiation. % Enrichment = fold enrichment over input x 100
(G) Gene expression analysis by qRT-PCR of PpGs in P19 ECCs expressing recombinant Myc-Oct4. The Ct values were normalized to Gapdh, and expression is shown relative to that in undifferentiated cells (dotted line).
(H) DNA methylation analysis of PpGe using Bis-seq in UD and D4 differentiated P19 ECCs WT and expressing recombinant Myc-Oct4. Oct4 expressing cells show failure to gain DNA methylation at PpGe post-differentiation compared to untransfected WT.
All experiments are an average of at least two biological replicates and error is shown as SEM. TCP, tranylcypromine; ECCs, embryonal carcinoma cells; PpGe, pluripotency gene enhancers; D4, days post-induction of differentiation.
