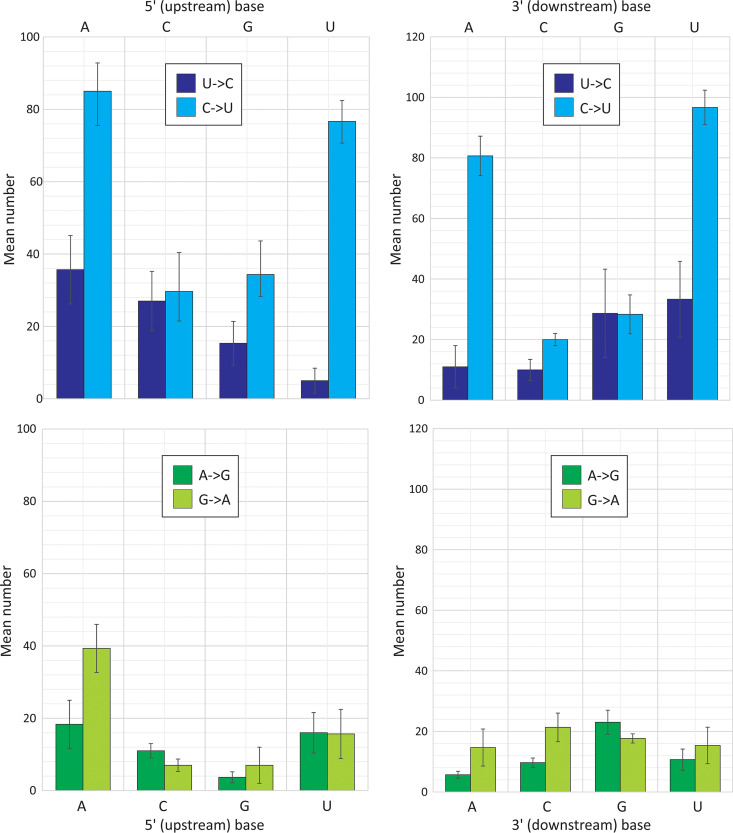
FIG 6.
Influence of 5′ and 3′ base contexts on C↔U and G↔A transition frequencies. Totals of each transition in the SARS-CoV-2 sequence data set split into subtotals based on the identity of the 5′ (left) and 3′ (right) base. Bar heights represent the means from the three sequence samples; error bars show standard deviations. A further division into the 16 combinations of 5′ and 3′ base contexts is provided in Fig. S1 in the supplemental material.

