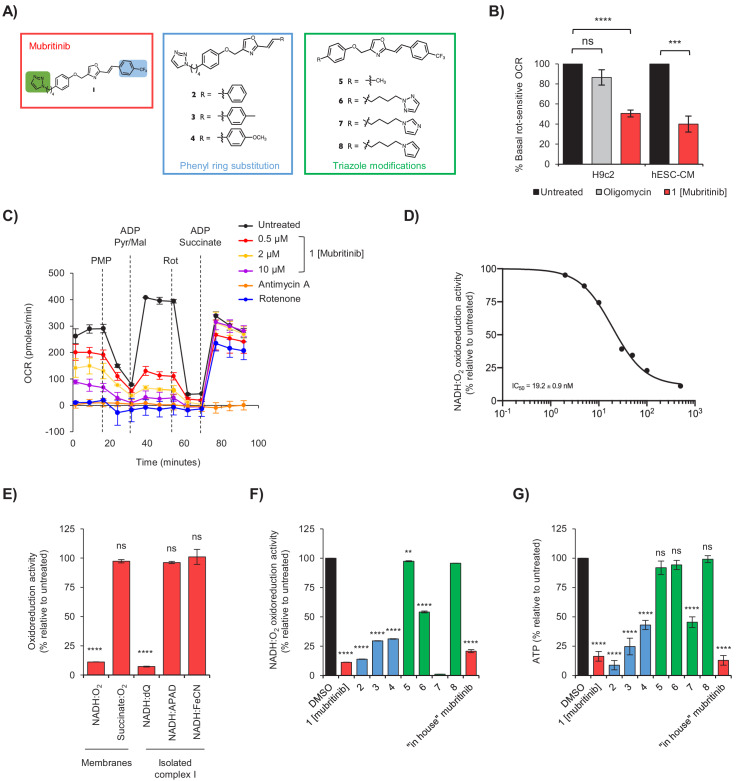
Figure 2. Mubritinib is an inhibitor of mitochondrial complex I.
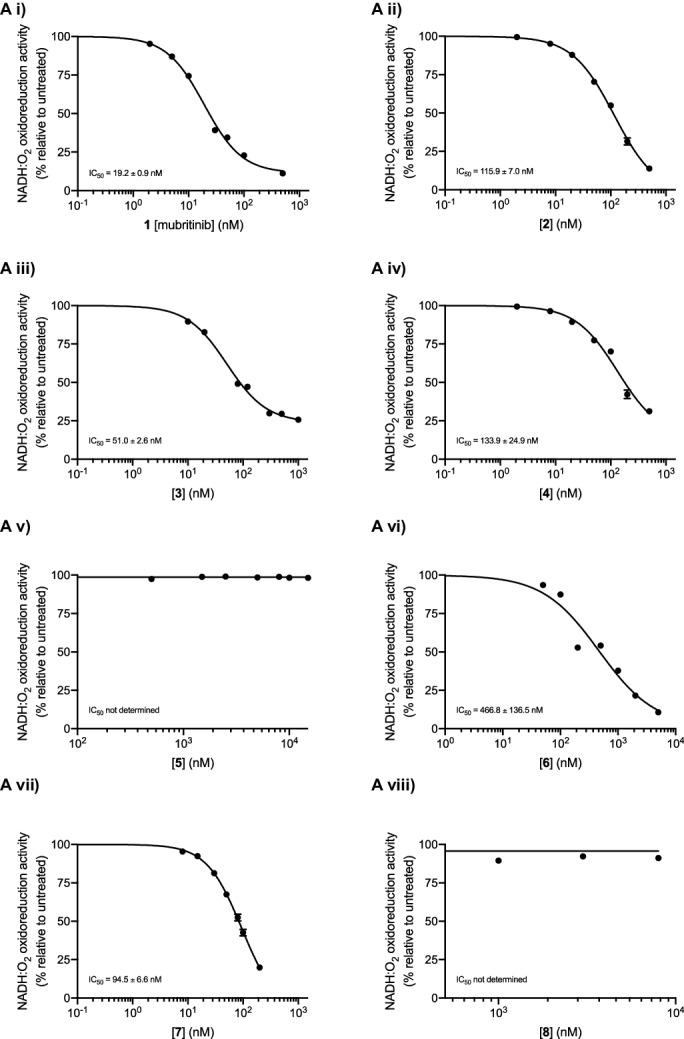
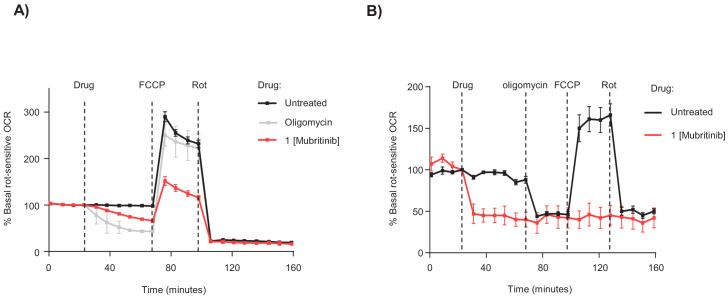
(A) Variants of mubritinib were synthesised with alterations to the trifluoromethylphenyl group (2, 3 and 4) or the triazole (5, 6, 7 and 8). Mubritinib (1) and mubritinib synthesised ‘in house’ were used as positive controls. (B) Rotenone-sensitive oxygen consumption rates (OCRs) of H9c2 or hESC-CM cells in glucose containing media were measured after the addition of FCCP in the presence of either 1 μM mubritinib or 1 μM oligomycin A. OCR values are represented relative to untreated cells and error bars represent standard deviation (n = 3). Significance was assessed using the unpaired students t-test (*** p = <0.001, **** p = <0.0001, ns = not significant). (C) OCR was measured in cells pre-treated with 0.5 μM, 2 μM and 10 μM mubritinib, 1 μM rotenone or 10 μM antimycin A using a Seahorse XF Analyzer. PMP was added to permeabilise the plasma membrane, followed by pyruvate, malate and ADP to drive complex I linked respiration. Then, rotenone was added to abolish complex I respiration followed by ADP and succinate to drive complex II linked respiration. Error bars represent standard deviation (n = 3). (D) Mubritinib was incubated with mitochondrial membranes from bovine heart at the concentrations shown, then the rate of NADH was measured spectrophotometrically. Error bars represent standard error of the mean (n = 3). Data were fit using activity (%) = 100/(1 + (IC50 / [inhibitor])Hill slope and yielded an IC50 value of 19.2 nM. (E) Relative rates of NADH or succinate oxidation by mitochondrial membranes or complex I isolated from bovine heart using O2, dQ, APAD+, or FeCN as the electron acceptor in the presence of 500 nM mubritinib. Error bars represent standard deviation (n = 3) and significance was assessed using ANOVA with Dunnett’s multiple comparisons test (****p<0.0001, ns = not significant). (F) Mubritinib and the variants from (A) were incubated with mitochondrial membranes at 500 nM. The rate of NADH oxidation was measured spectrophotometrically. The activity is expressed relative to the DMSO control, set to 100%. Error bars represent standard deviation (n = 3) and significance was assessed using ANOVA with Dunnett’s multiple comparisons test (****p<0.0001, **p<0.01). Activities were inter/extrapolated from measured data points for compounds 7 and 8. (G) H9c2 cells were treated with mubritinib and all compound variants (10 μM) in galactose containing media for 24 hr and ATP levels were measured. Error bars represent standard deviation (n = 3) and significance was assessed using ANOVA with Dunnett’s multiple comparisons test (****p<0.0001, ns = not significant).
Figure 2—figure supplement 1. Mubritinib inhibits OCR in H9c2 and hESC-CM.
Figure 2—figure supplement 2. Complex I inhibition by mubritinib and the synthesised variant compounds.


