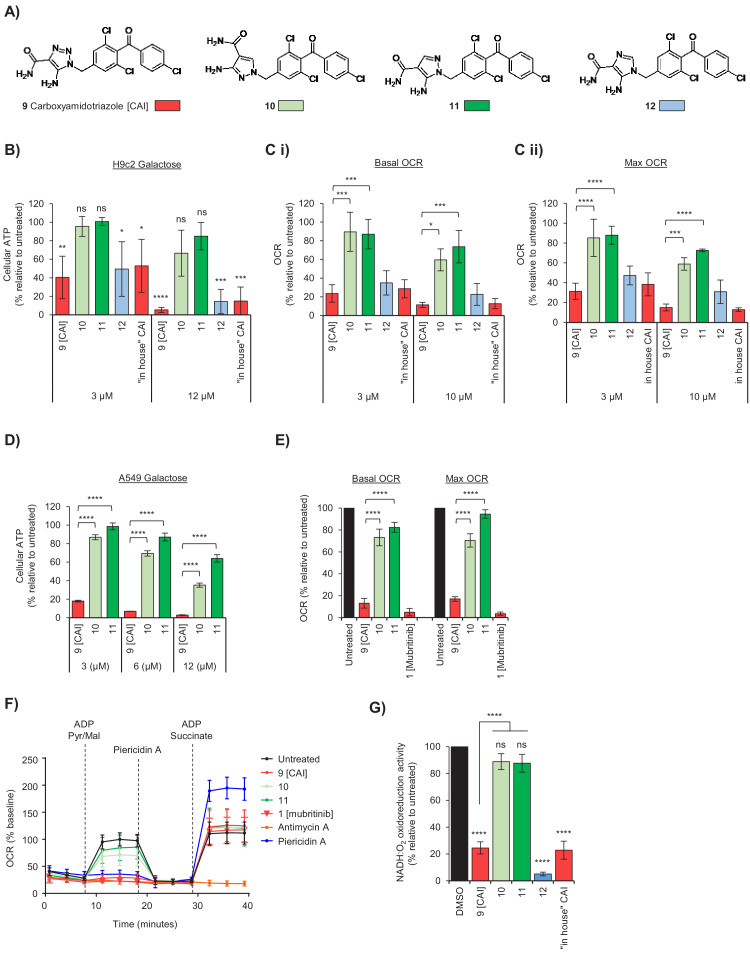
Figure 3. The toxicophore present in carboxyamidotriazole inhibits mitochondrial complex I.
(A) Chemical structure of carboxyamidotriazole (CAI) (9) and three variants whereby the core triazole ring was replaced with either a pyrazole (10 and 11) or imidazole (12). For the pyrazoles, 11 is an analogue of 9 with one of the triazole nitrogens removed, whereas 10 also removes one of the triazole nitrogen atoms whilst additionally shifting the trichlorobenzophenonemethyl moiety to the 2-position equivalent. (B) H9c2 cells were treated with 3, 6 or 12 μM of CAI (9), 10, 11, 12 or the ‘in house’ synthesised CAI in galactose containing media and after 24 hr ATP levels were measured and data shown are relative to the untreated control (n = 3). Significance was assessed using ANOVA with Dunnett’s multiple comparisons test (****p<0.0001, ***p<0.001, **p<0.01, *p<0.05, ns = not significant). (C) Basal (i) and maximum (ii) oxygen consumption rates were measured using a Seahorse XF Analyzer in H9c2 cells treated with 3 and 10 μM of either CAI (9), 10, 11, 12 or the ‘in house’ synthesised CAI. Error bars represent standard deviation (n = 3) and significance was assessed using ANOVA with Tukey’s multiple comparisons test (****p<0.0001, ***p<0.001, *p<0.05). (D) A549 cells were treated with 3, 6 or 12 μM of CAI (9) or 10 and 11 in galactose containing media and after 24 hr ATP levels were measured and normalised to the untreated control. Error bars represent standard deviation (n = 3) and significance was assessed using ANOVA with Tukey’s multiple comparisons test (****p<0.0001). (E) Basal and maximum oxygen consumption rates were measured using a Seahorse XF Analyzer in A549 cells treated with 5 μM of either CAI (9), 10, 11; or 5 μM mubritinib. Error bars represent standard deviation (n = 3) and significance was assessed using ANOVA with Tukey’s multiple comparisons test (****p<0.0001). (F) A549 cells were pre-treated with either 5 μM CAI (9), 10, 11, mubritinib, antimycin A or piericidin A (complex I inhibitor) and the OCR was measured over the times indicated. PMP was added to permeabilise the plasma membranes followed by addition of pyruvate, malate and ADP to drive complex I respiration and OCR determined. Finally, piericidin A was added to abolish complex I respiration followed by ADP and succinate to drive complex II respiration and OCR was again measured. Representative trace from three independent experiments. (G) CAI (9), 10, 11, 12 and the ‘in house’ synthesised CAI were incubated with mitochondrial membranes at 500 nM. The rate of NADH oxidation was measured spectrophotometrically. The activity is expressed relative to the DMSO control, set to 100%. Error bars represent standard deviation (n = 3) and significance was assessed using ANOVA with Tukey’s multiple comparisons test (****p<0.0001, ns = not significant). Activities were interpolated from measured data points for compounds 10, 11, 12 and ‘in house’ CAI.


